The VideoMatics area of our Gateway is critical to understanding your fleet efficiency and compliance.
Account owners, directors, or people with overall fleet management responsibility across multiple depots.
Depot or regional fleet managers will see useful charts and reports on their own drivers & vehicles.
Speeding, harsh braking or swerving events are logged and tabulated. They are searchable and sortable.
Account owners and high-level managers enter VideoMatics with access to all depots and divisions (where applicable).
When you enter VideoMatics, what you see depends on who you are.
Account managers have access to areas that may not be visible to depot managers.
The ability to see invoices or place orders is only available at this level.
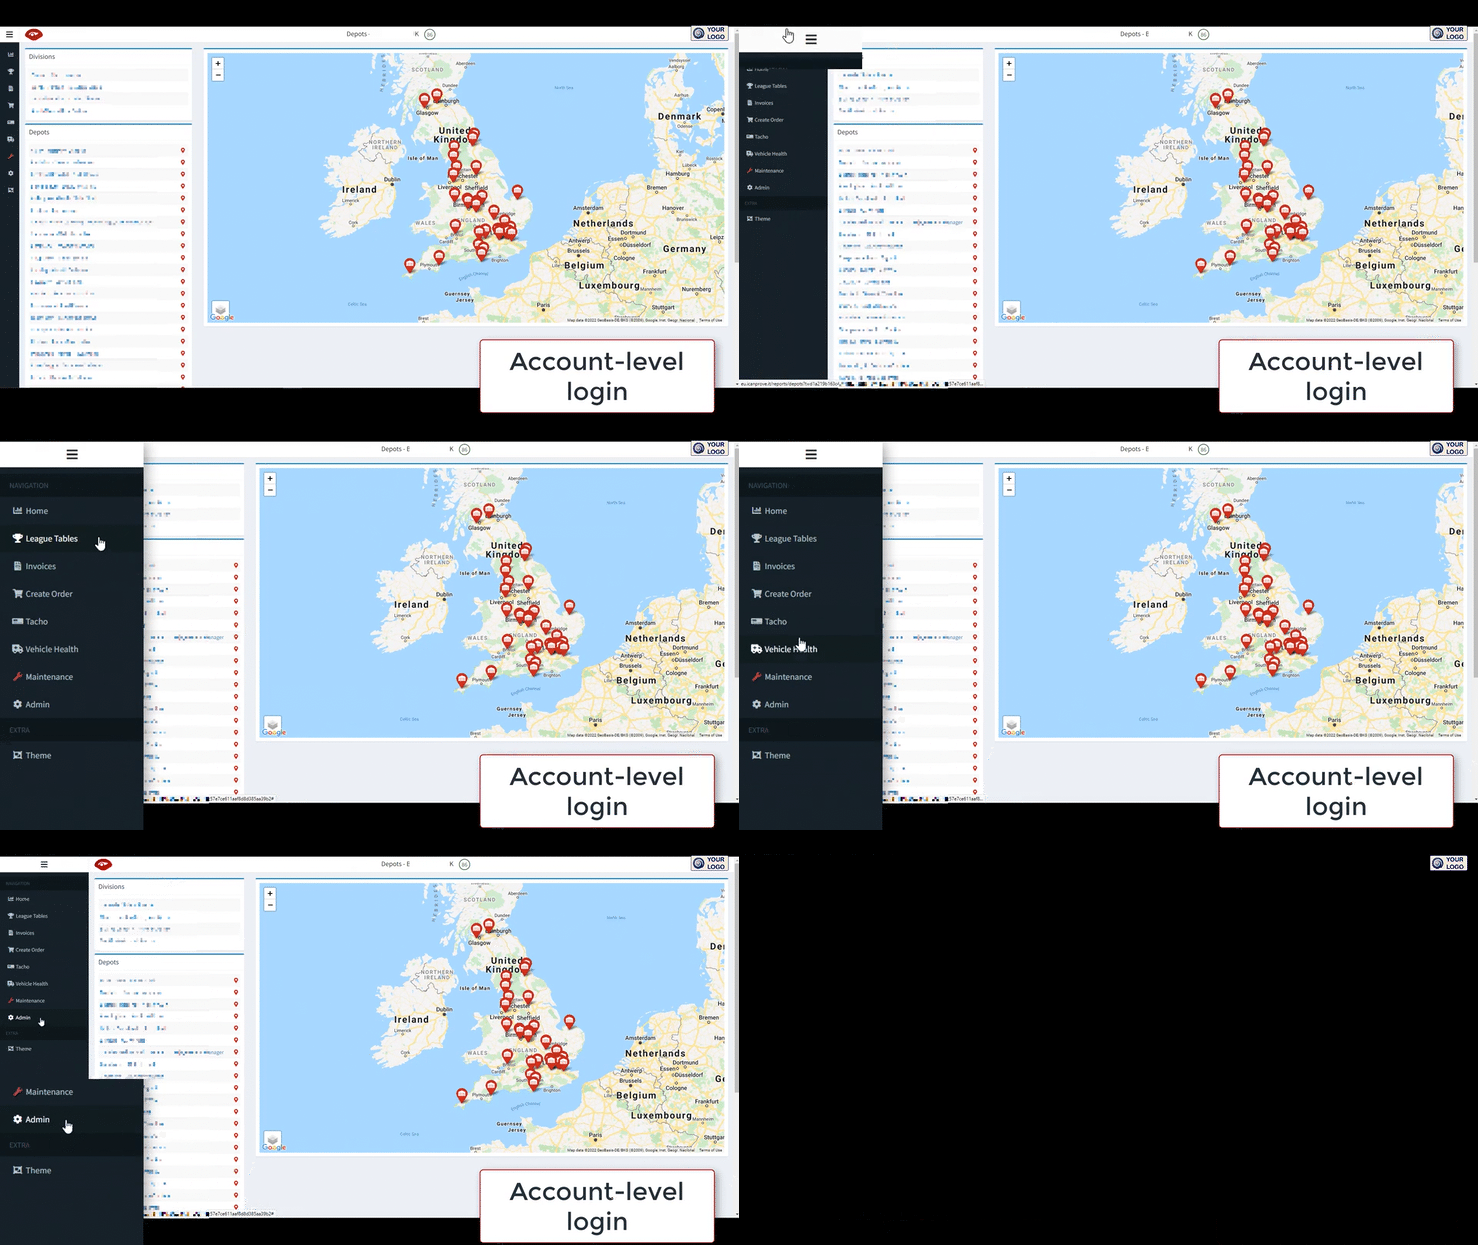
Account owners can see an interactive list of all divisions & depots that are associated with that account. These are available in a list or as pins on a map. Click on the link in the list or the pin to access that depot.
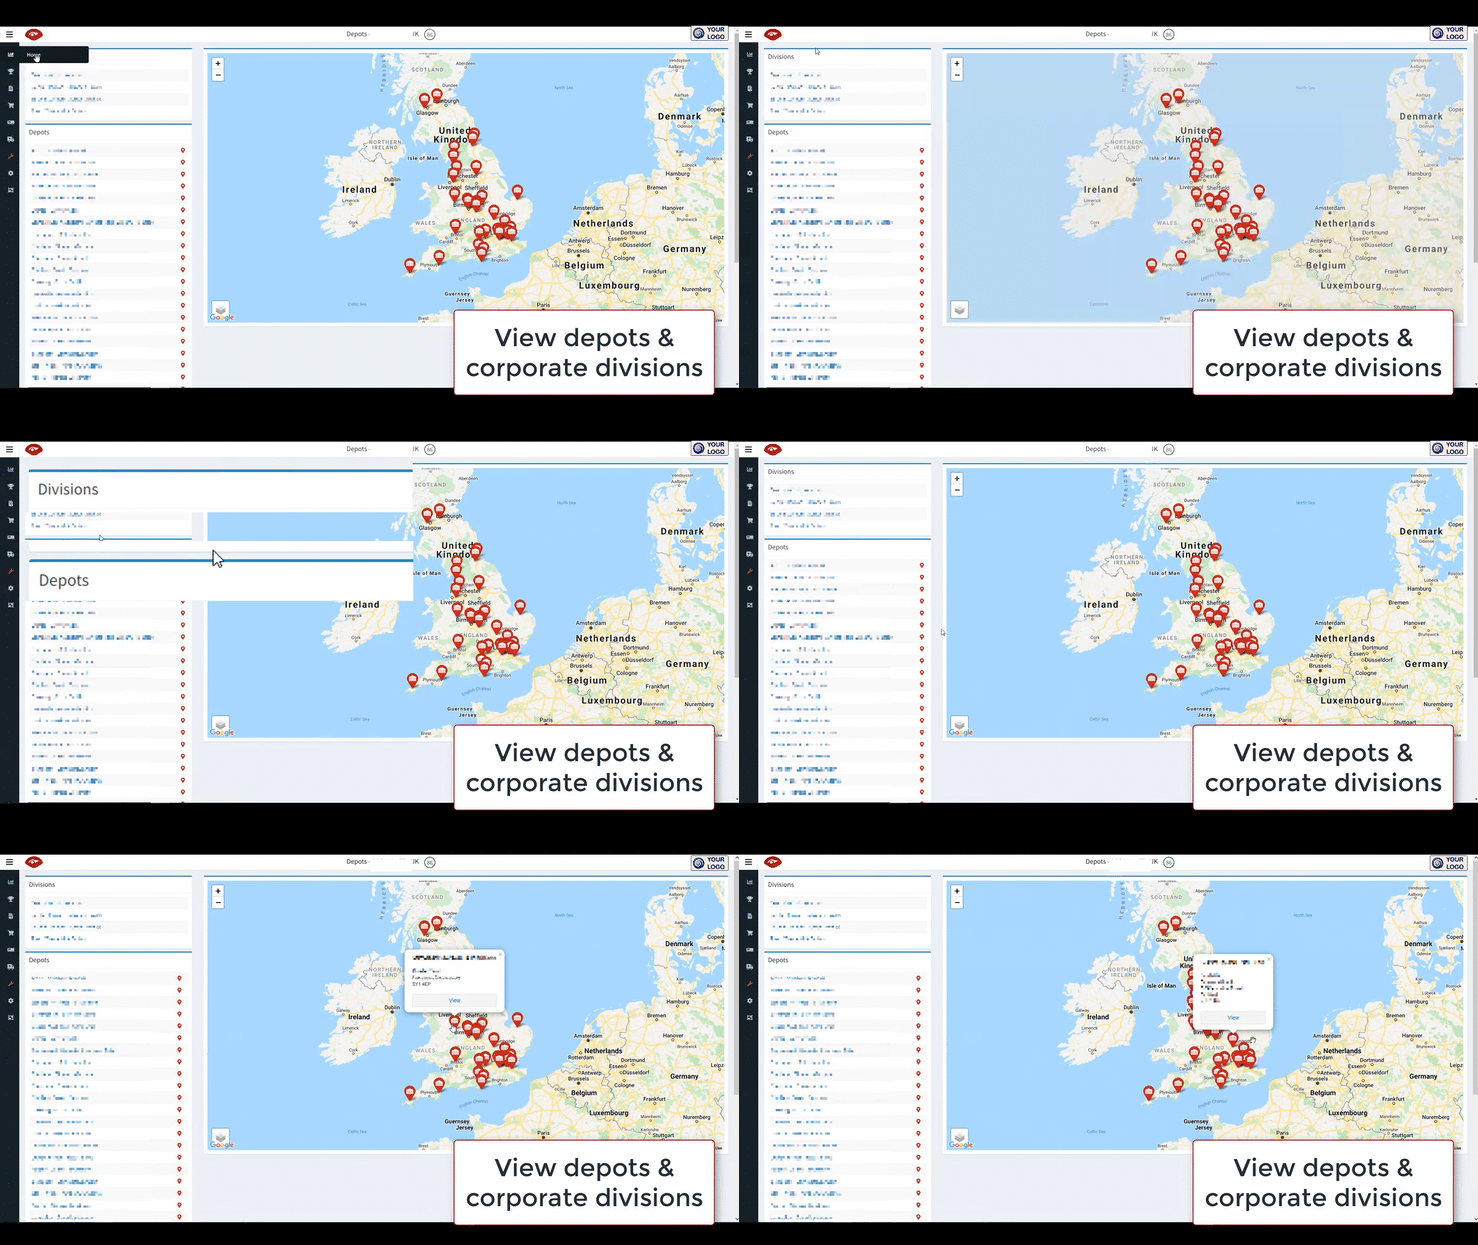
As the account owner, you can access league tables that compare each of your divisions and depots on key performance indicators.
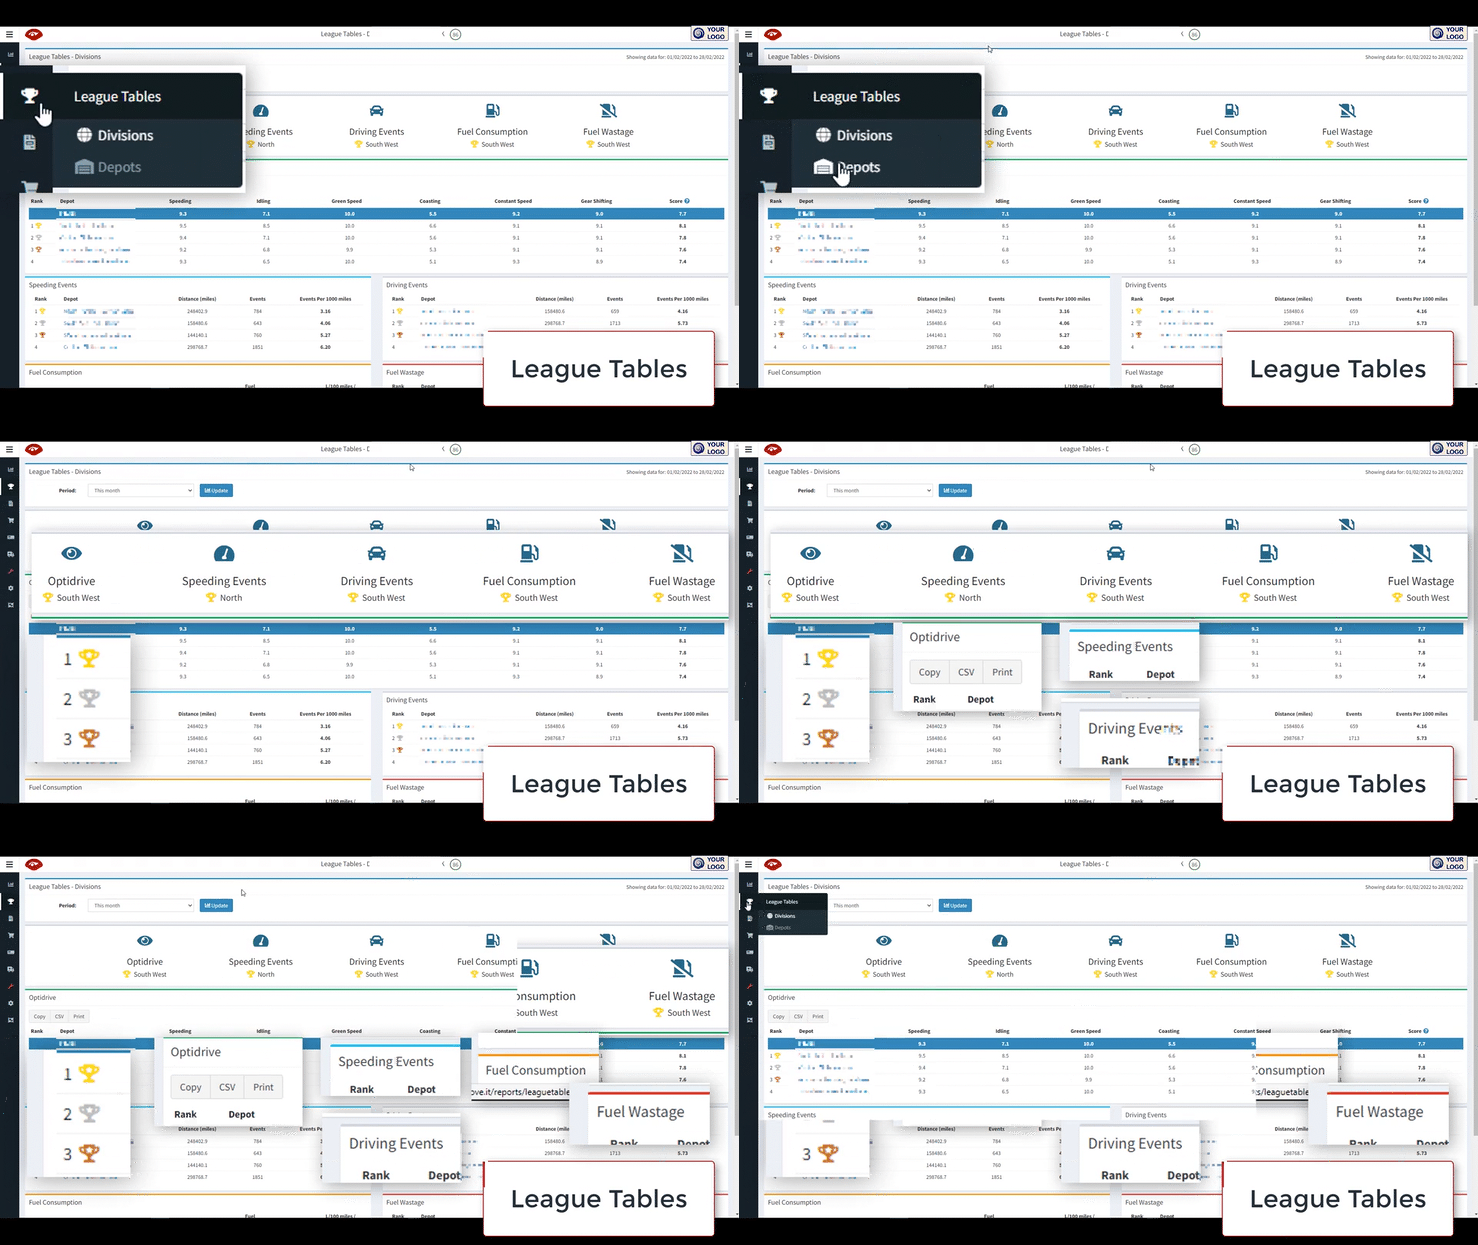
Only the account owners can see invoice reporting. Each invoice is clickable. You can search by keyword or view by time period.
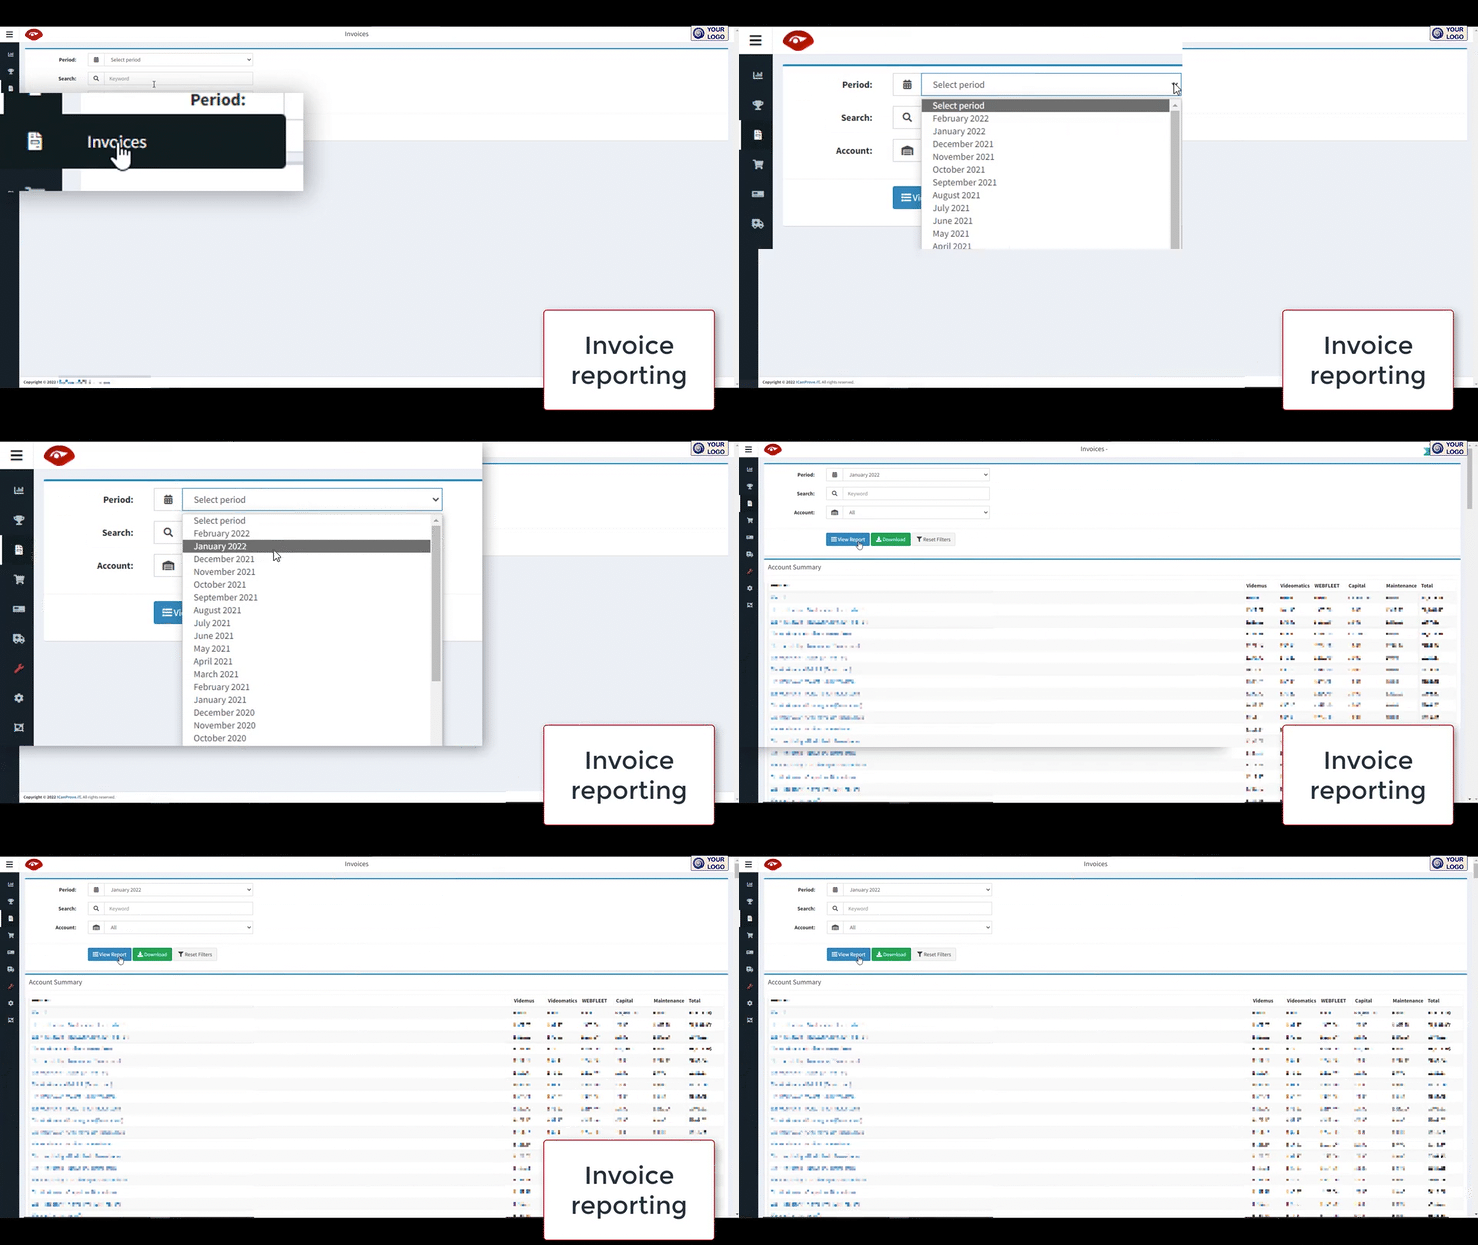
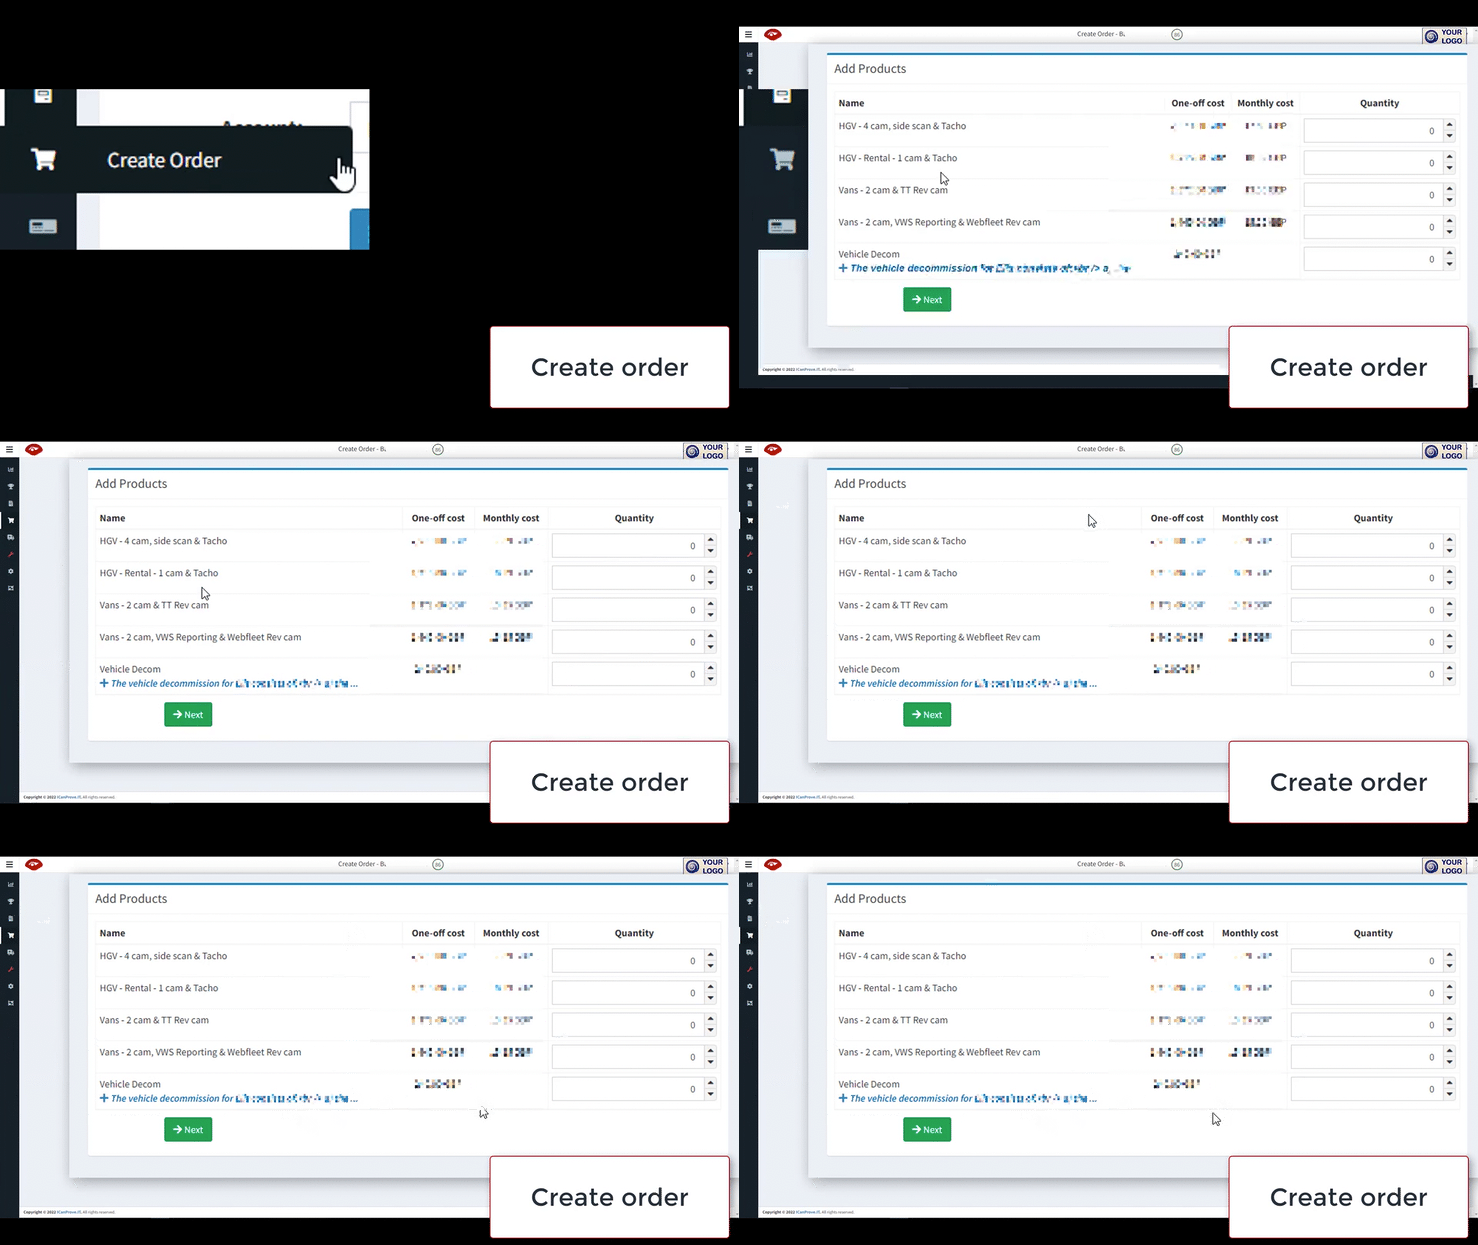
You can place an order or request a decommission through your login in VideoMatics.
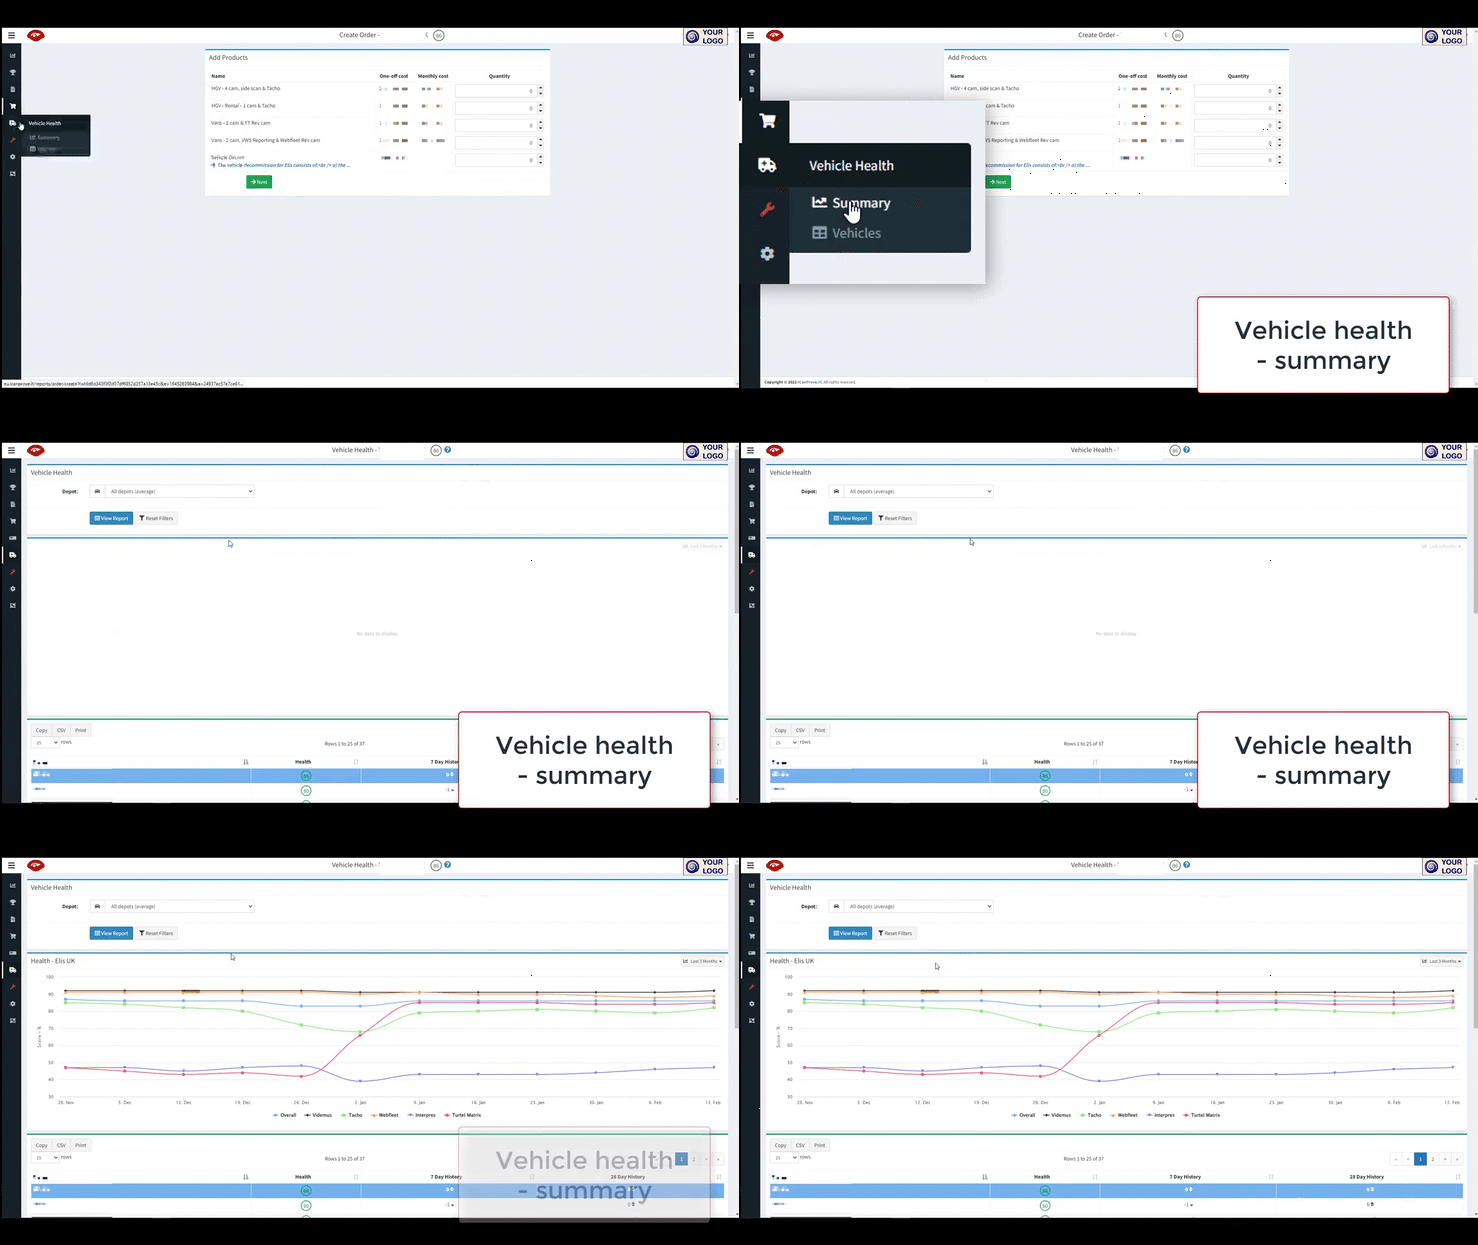
You can see an overview of vehicle technology health across your entire fleet.
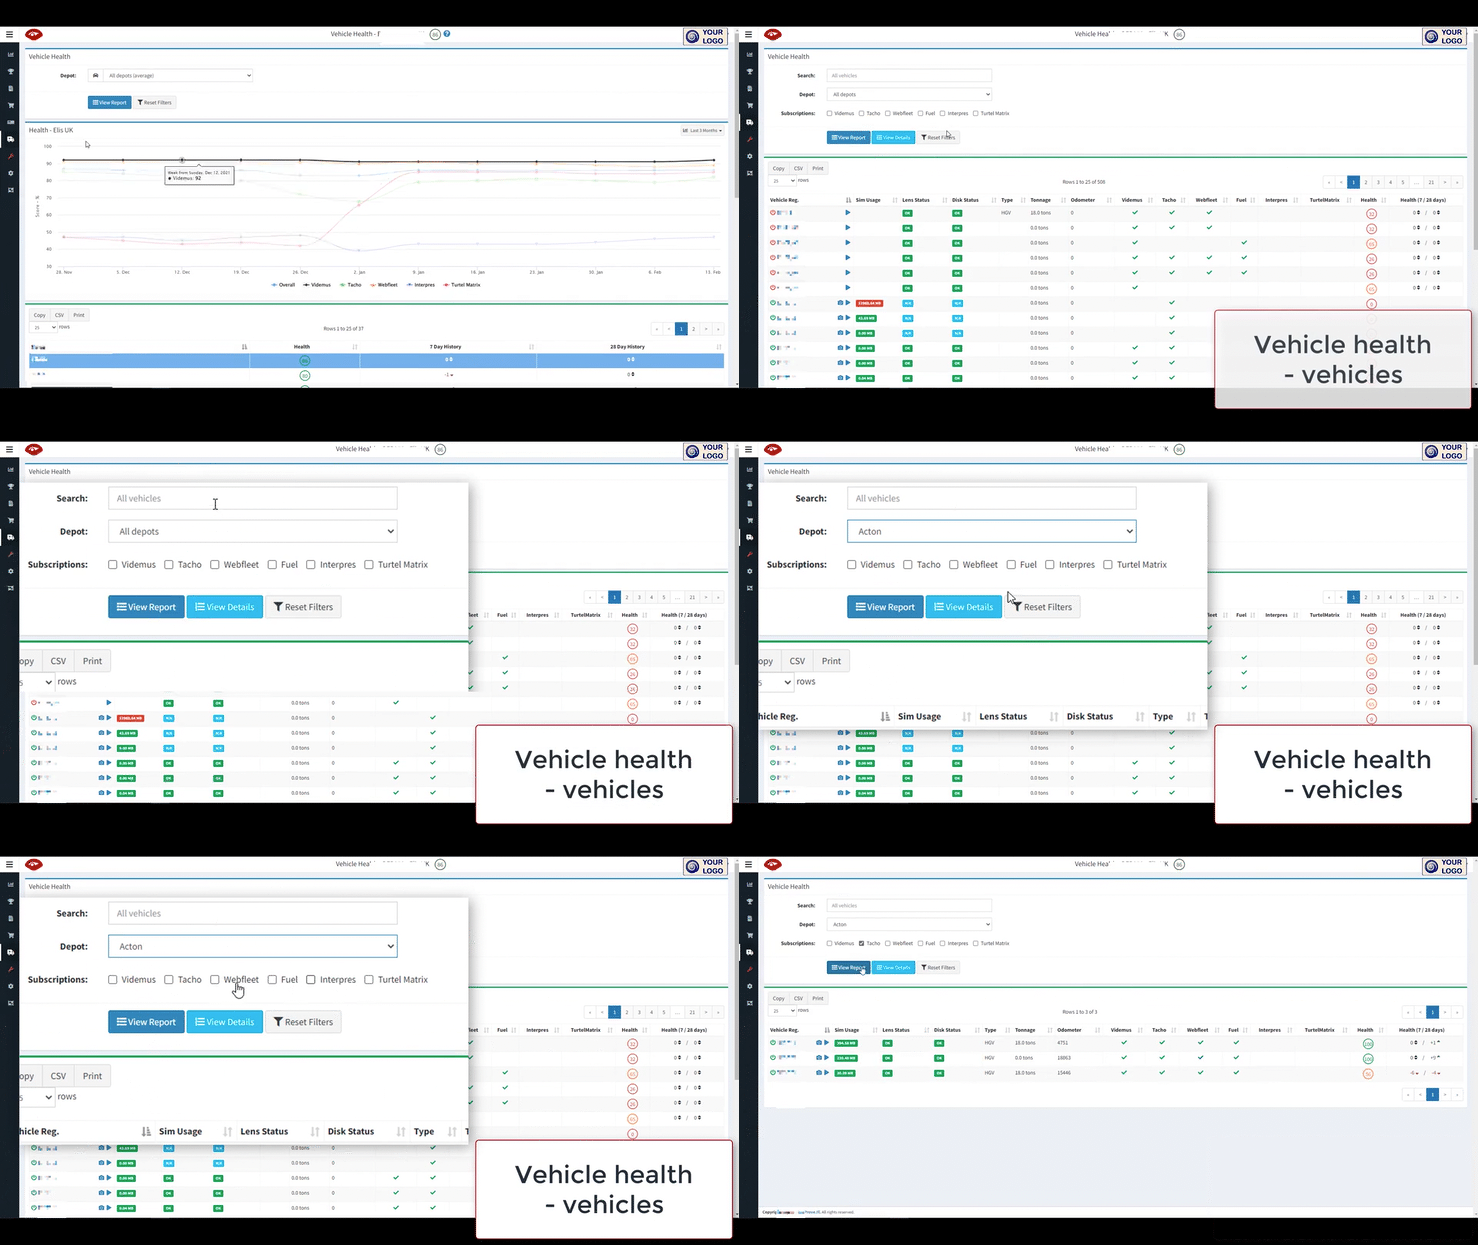
The table of all vehicles gives more details. It is fully searchable and sortable.
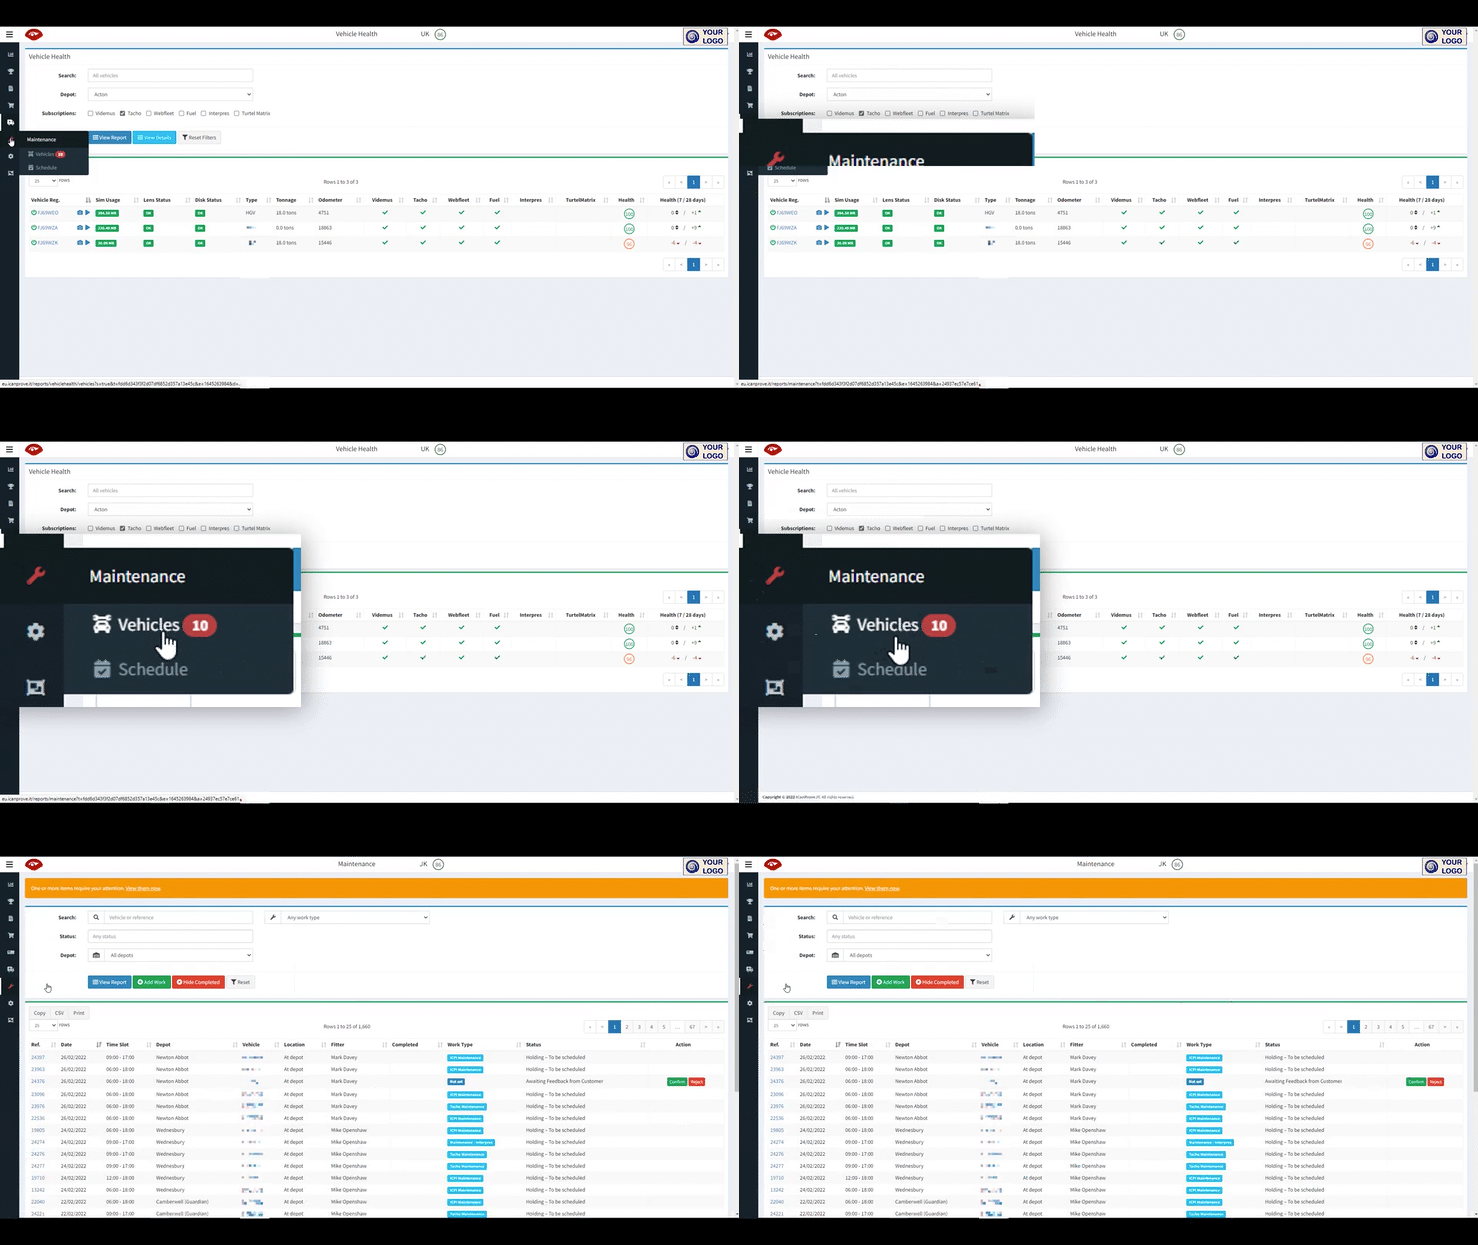
The maintenance section gives access to the whole fleet.
For more details, please see the dedicated maintenance section.
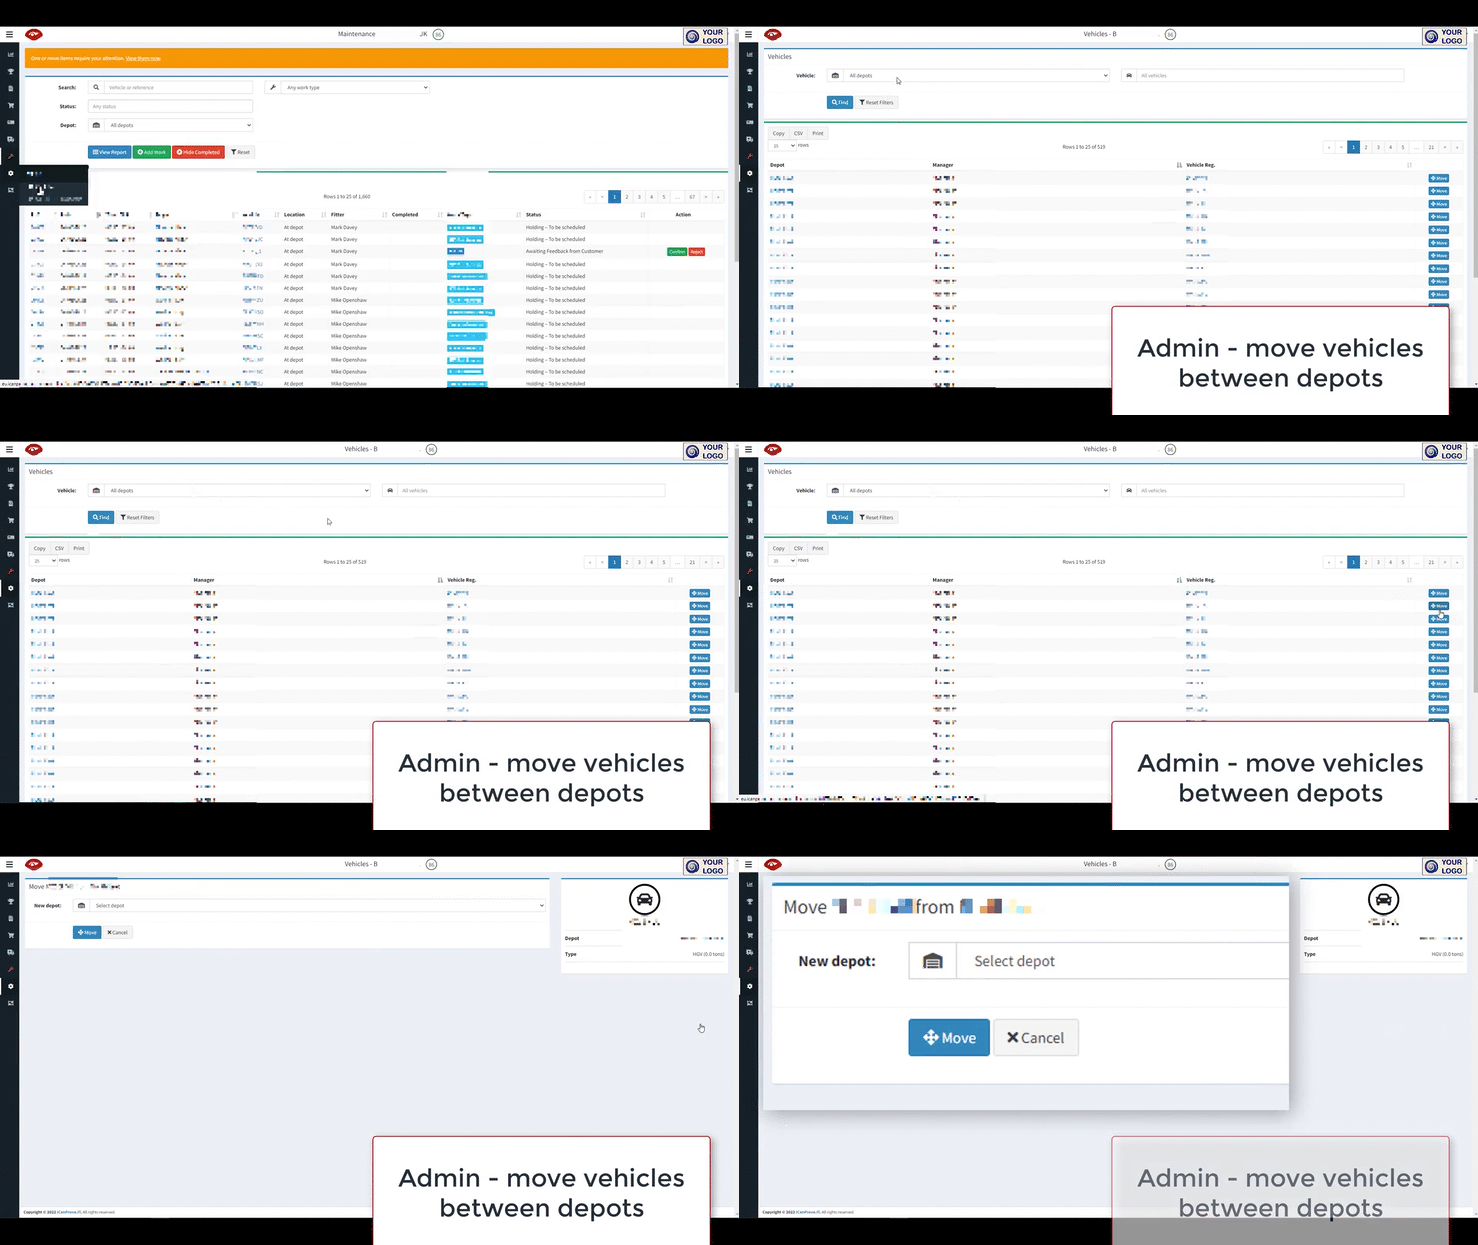
The admin section allows you to view all vehicles and password access for users.
This is the place where you assign vehicles to the correct depot, or move a vehicle from one sepot to another.
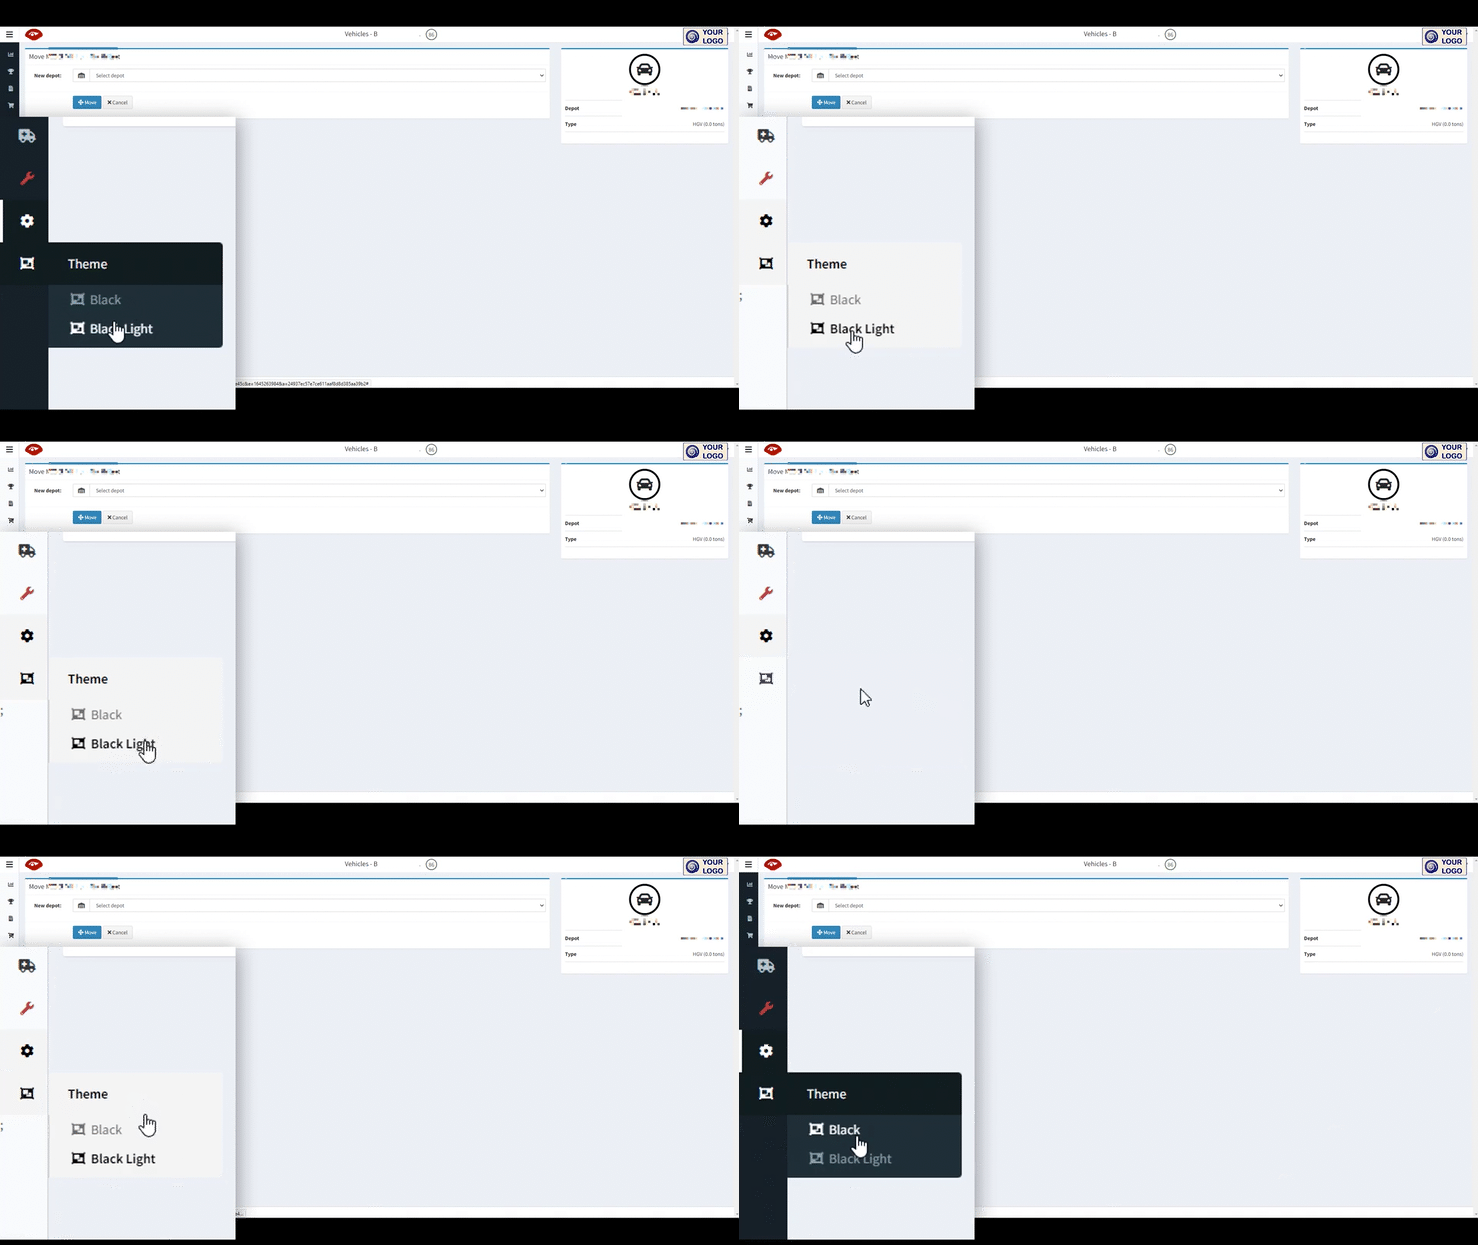
The final menu item allows you to change the menu from white on black to black on white, just in case this helps accessability and visibility for you.
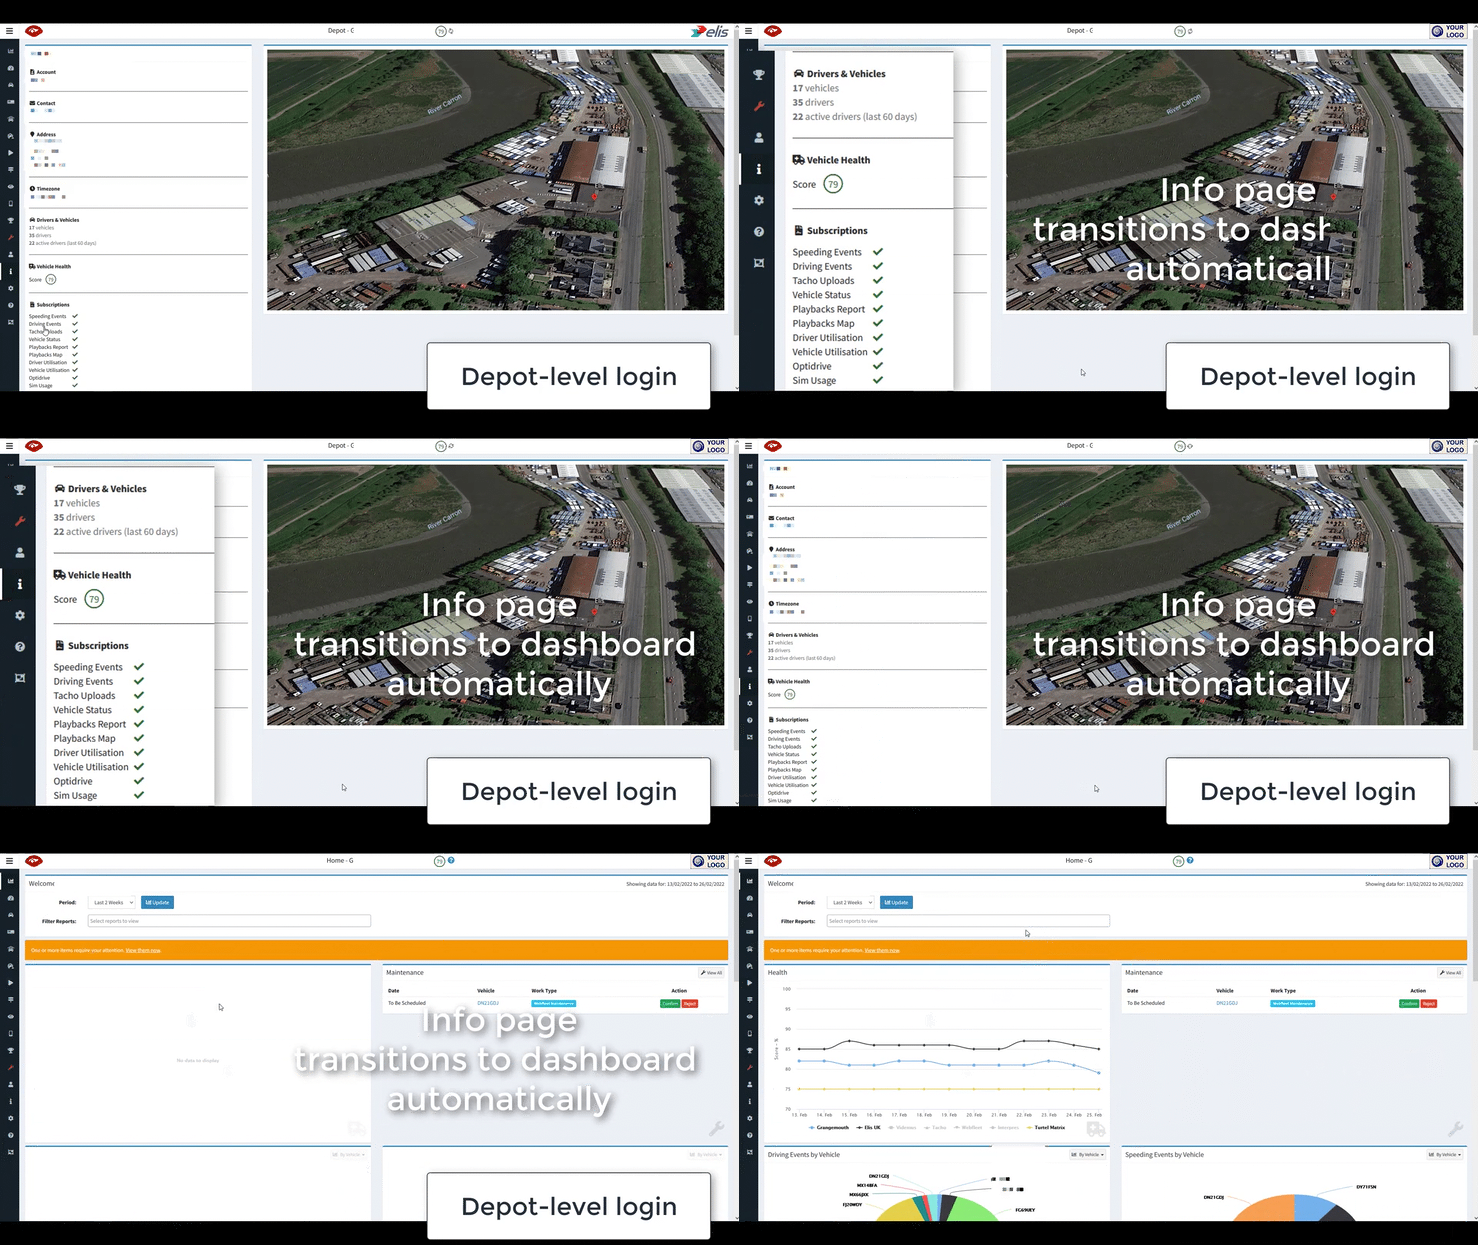
Once you choose your depot of interest (or if you login as a depot manager), you will start at a depot info page, before being automatically forwarded to your dashboard.
After a few seconds of viewing the depot info summary, your view will automatically refresh to show the data dashboard, with useful overview charts.
There are multiple charts, please explore them all.
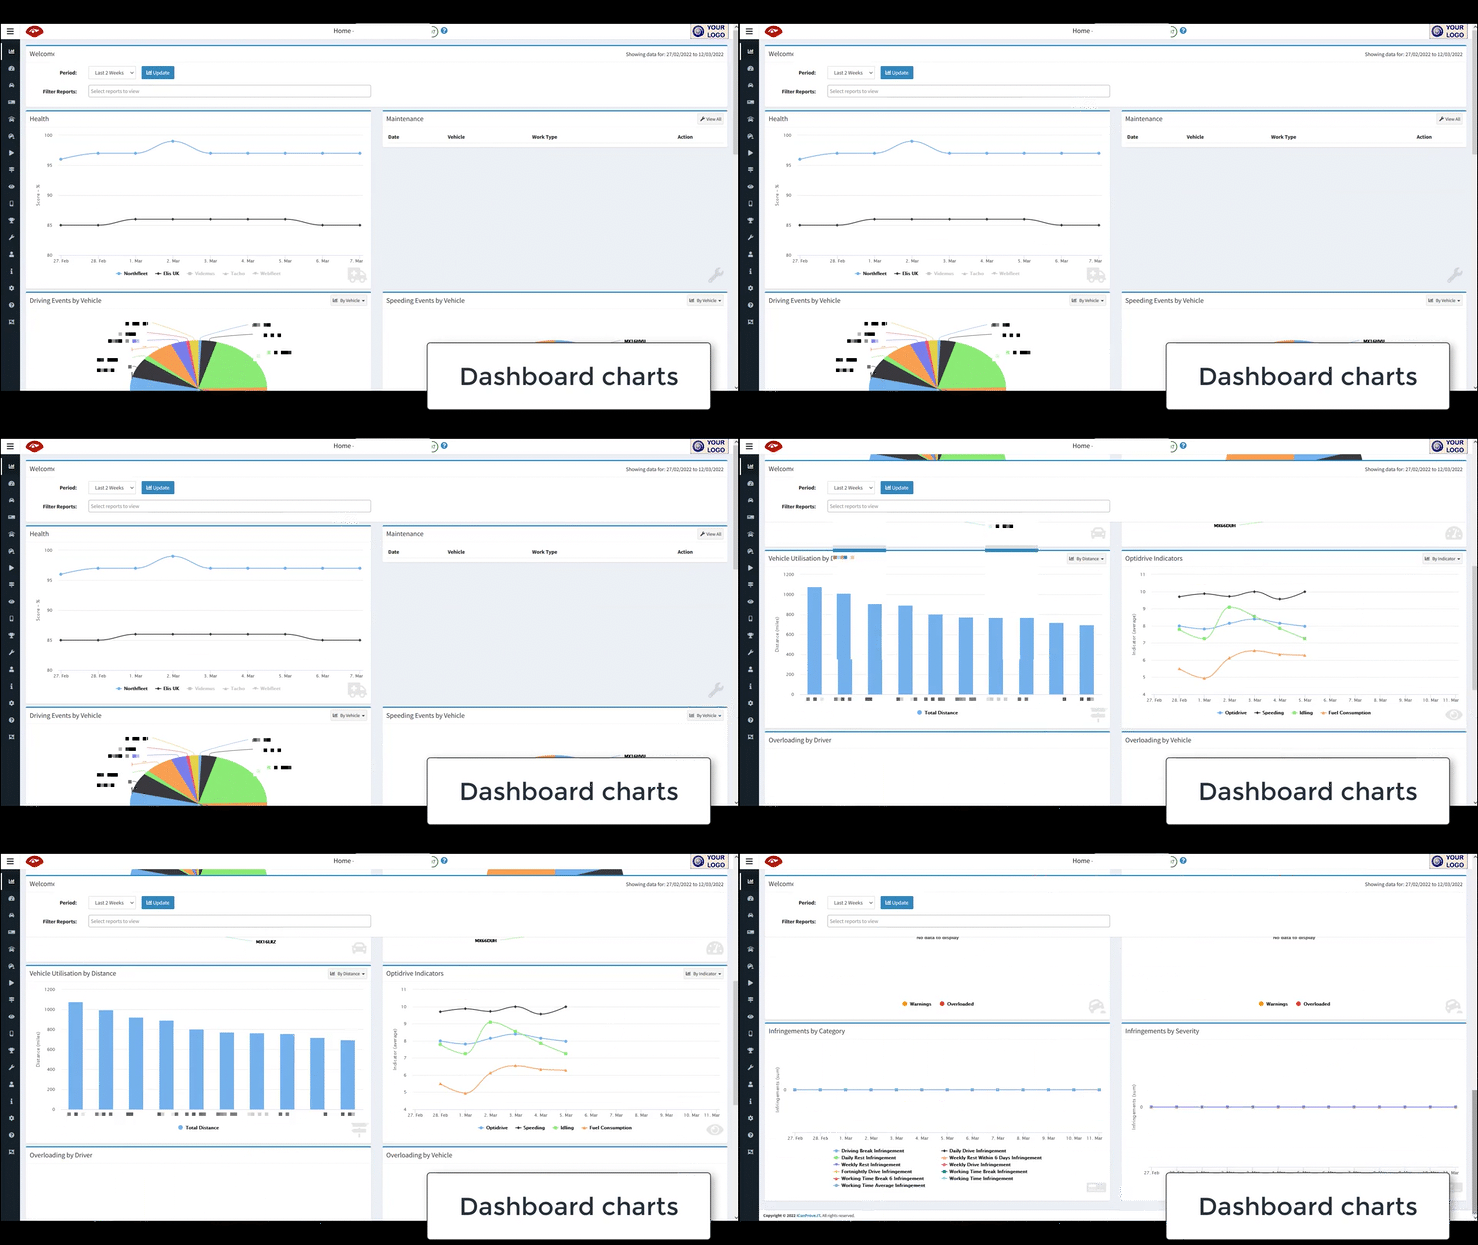
Use the drop-down list to select which charts to show.
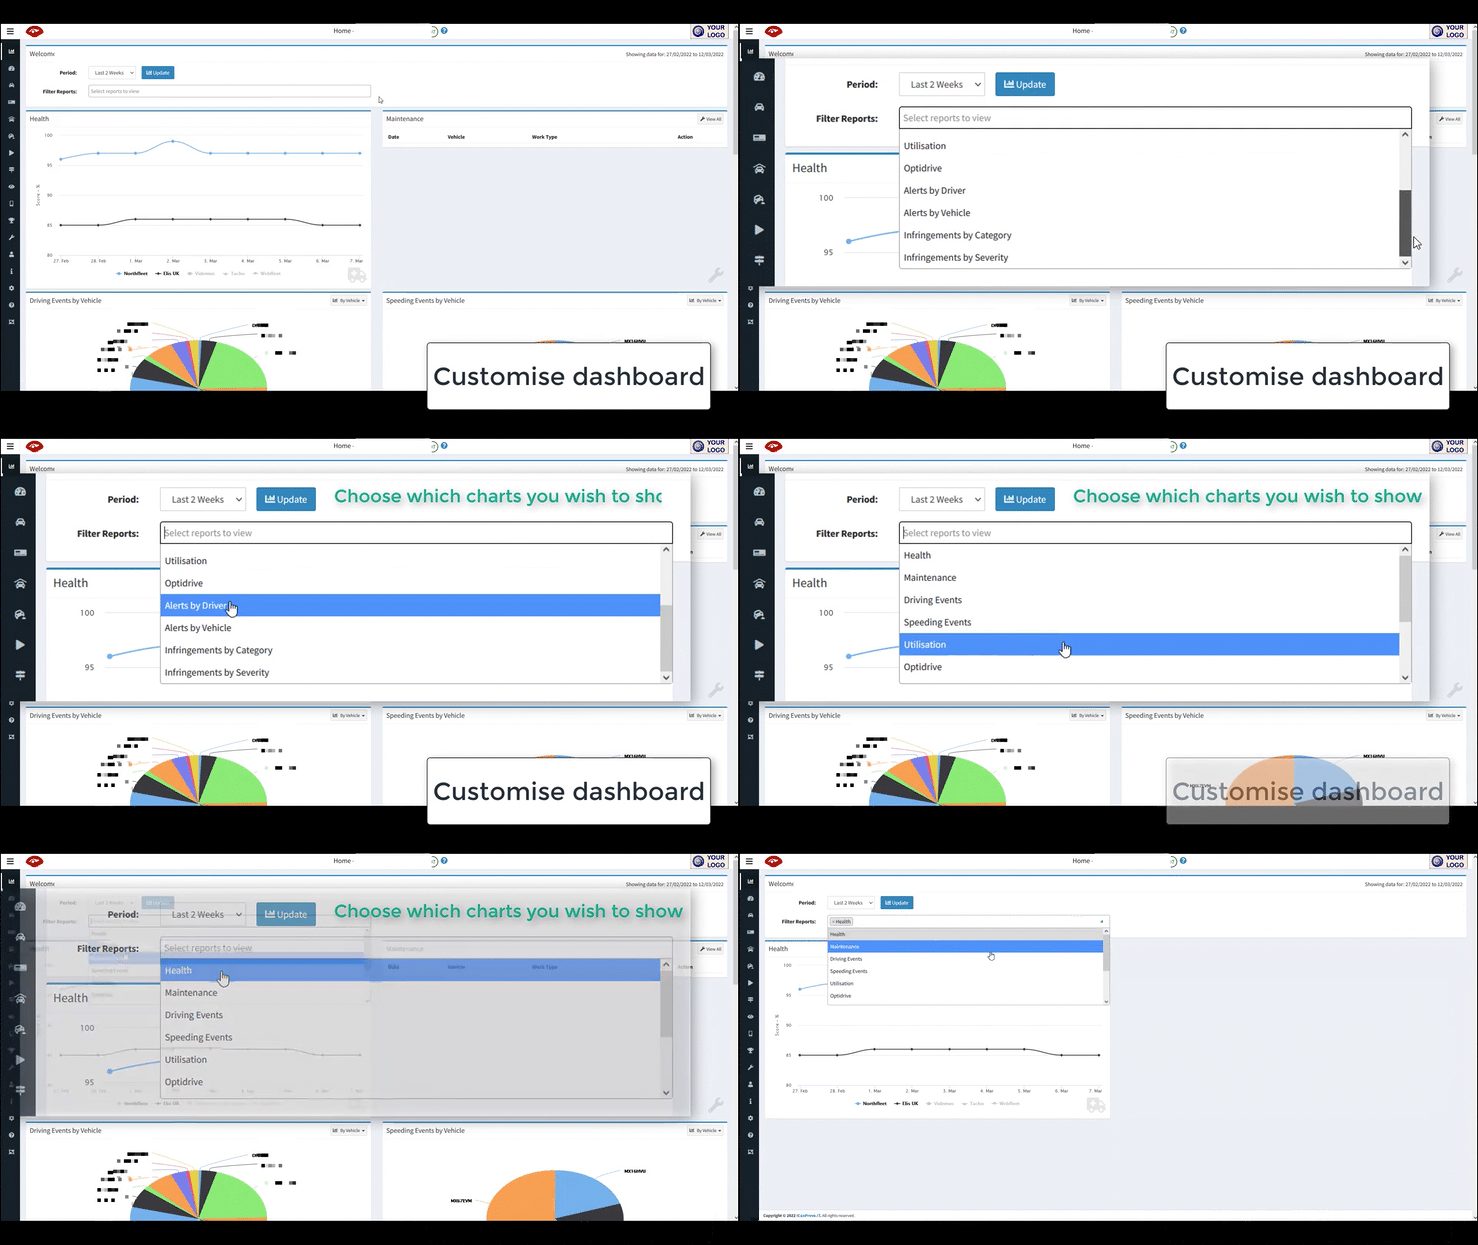
There is also a dorp-down list to select the time-period of interest.
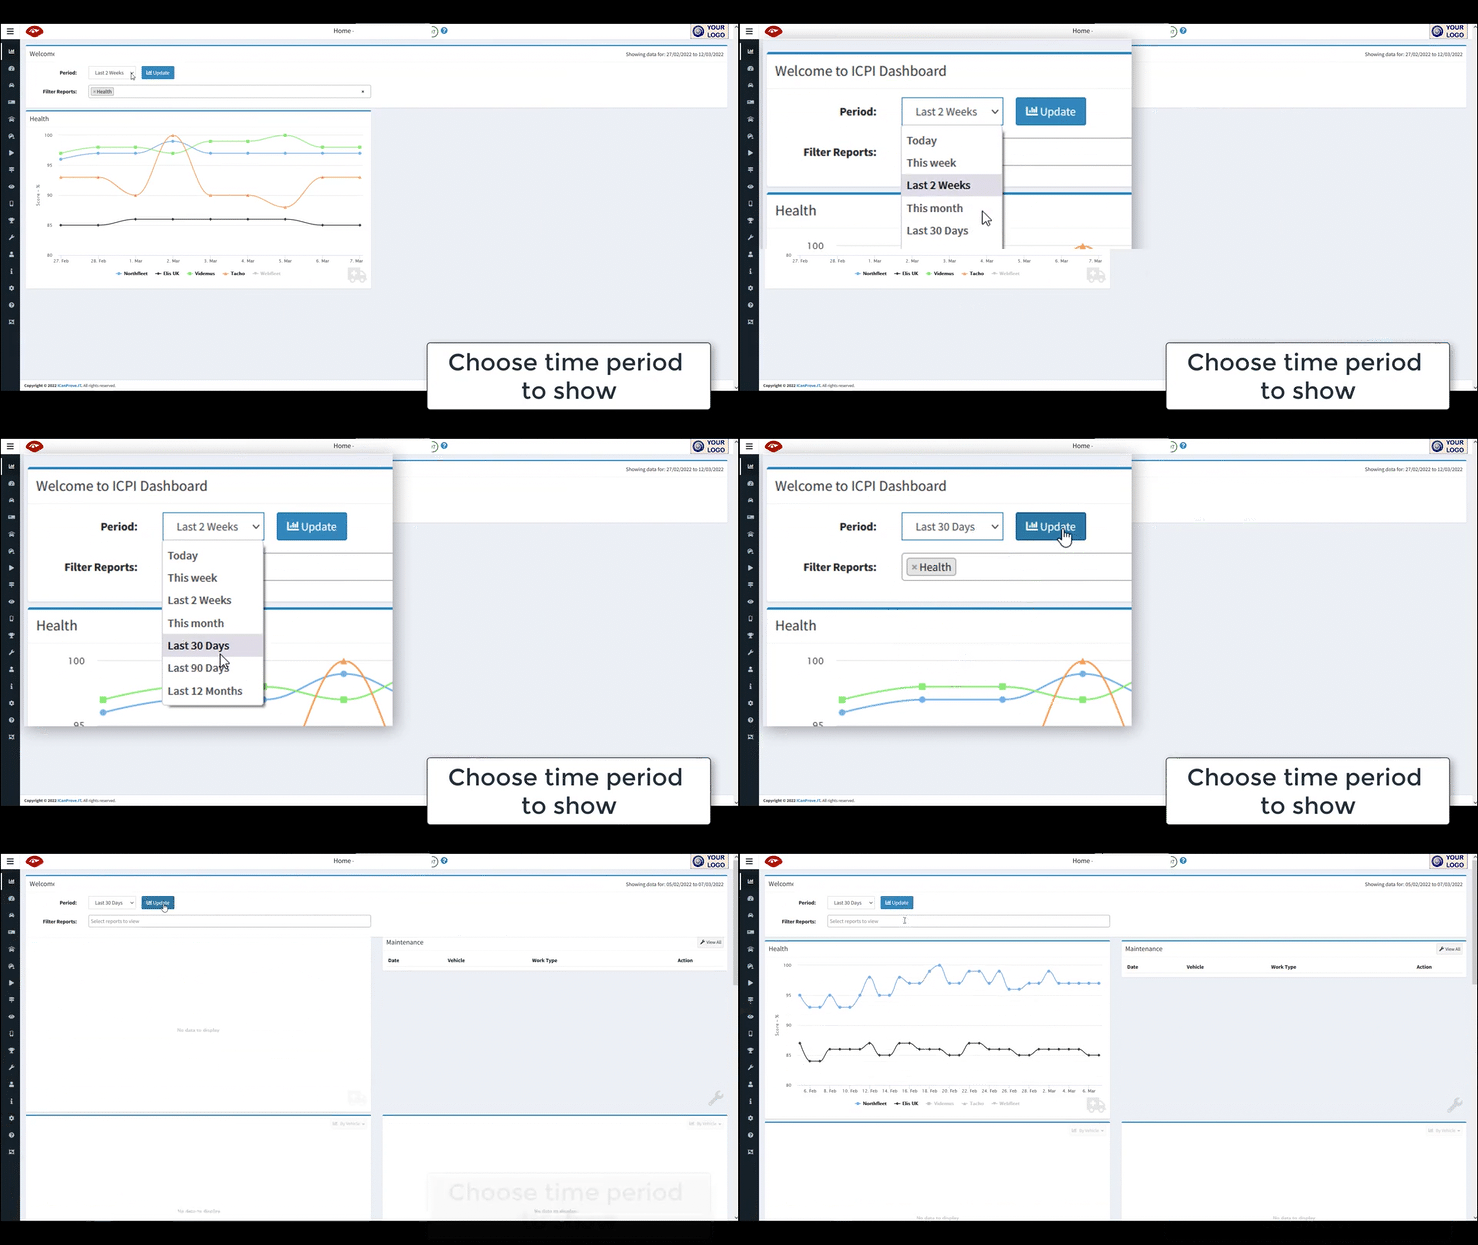
You can:
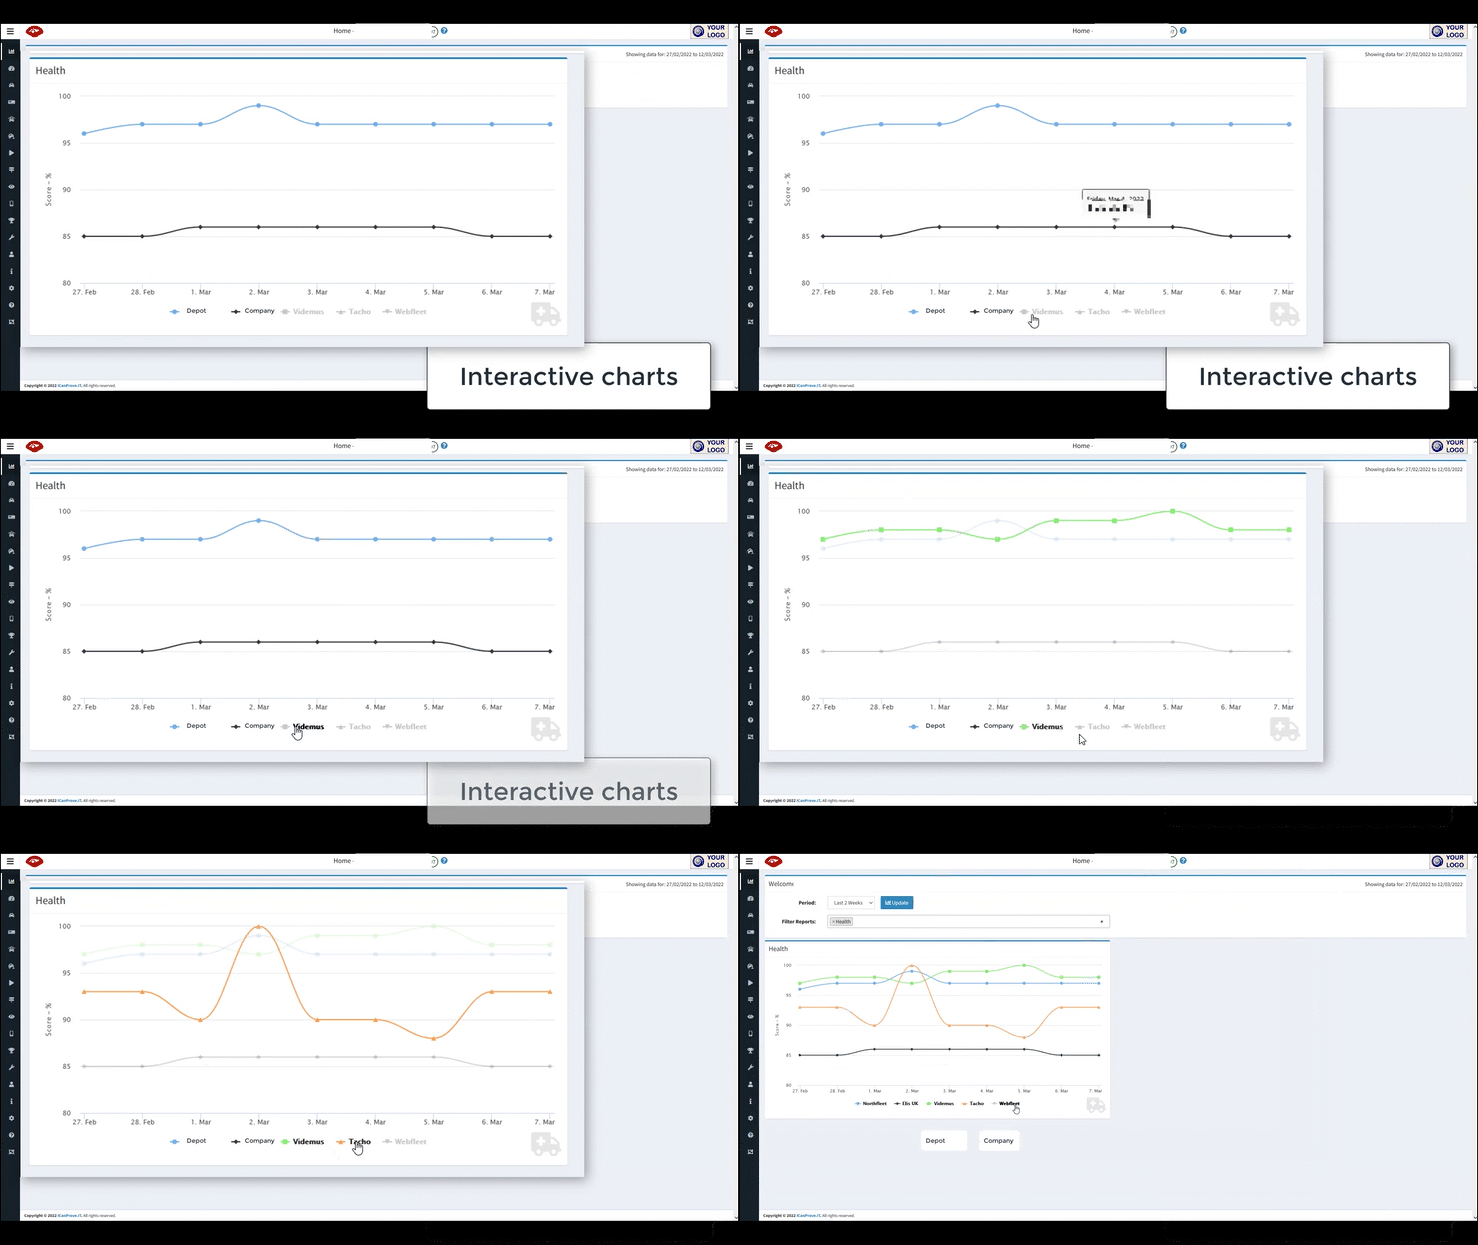
In summary, you can interact with each of the charts in multiple ways, or use them to delve deeper into other reports.
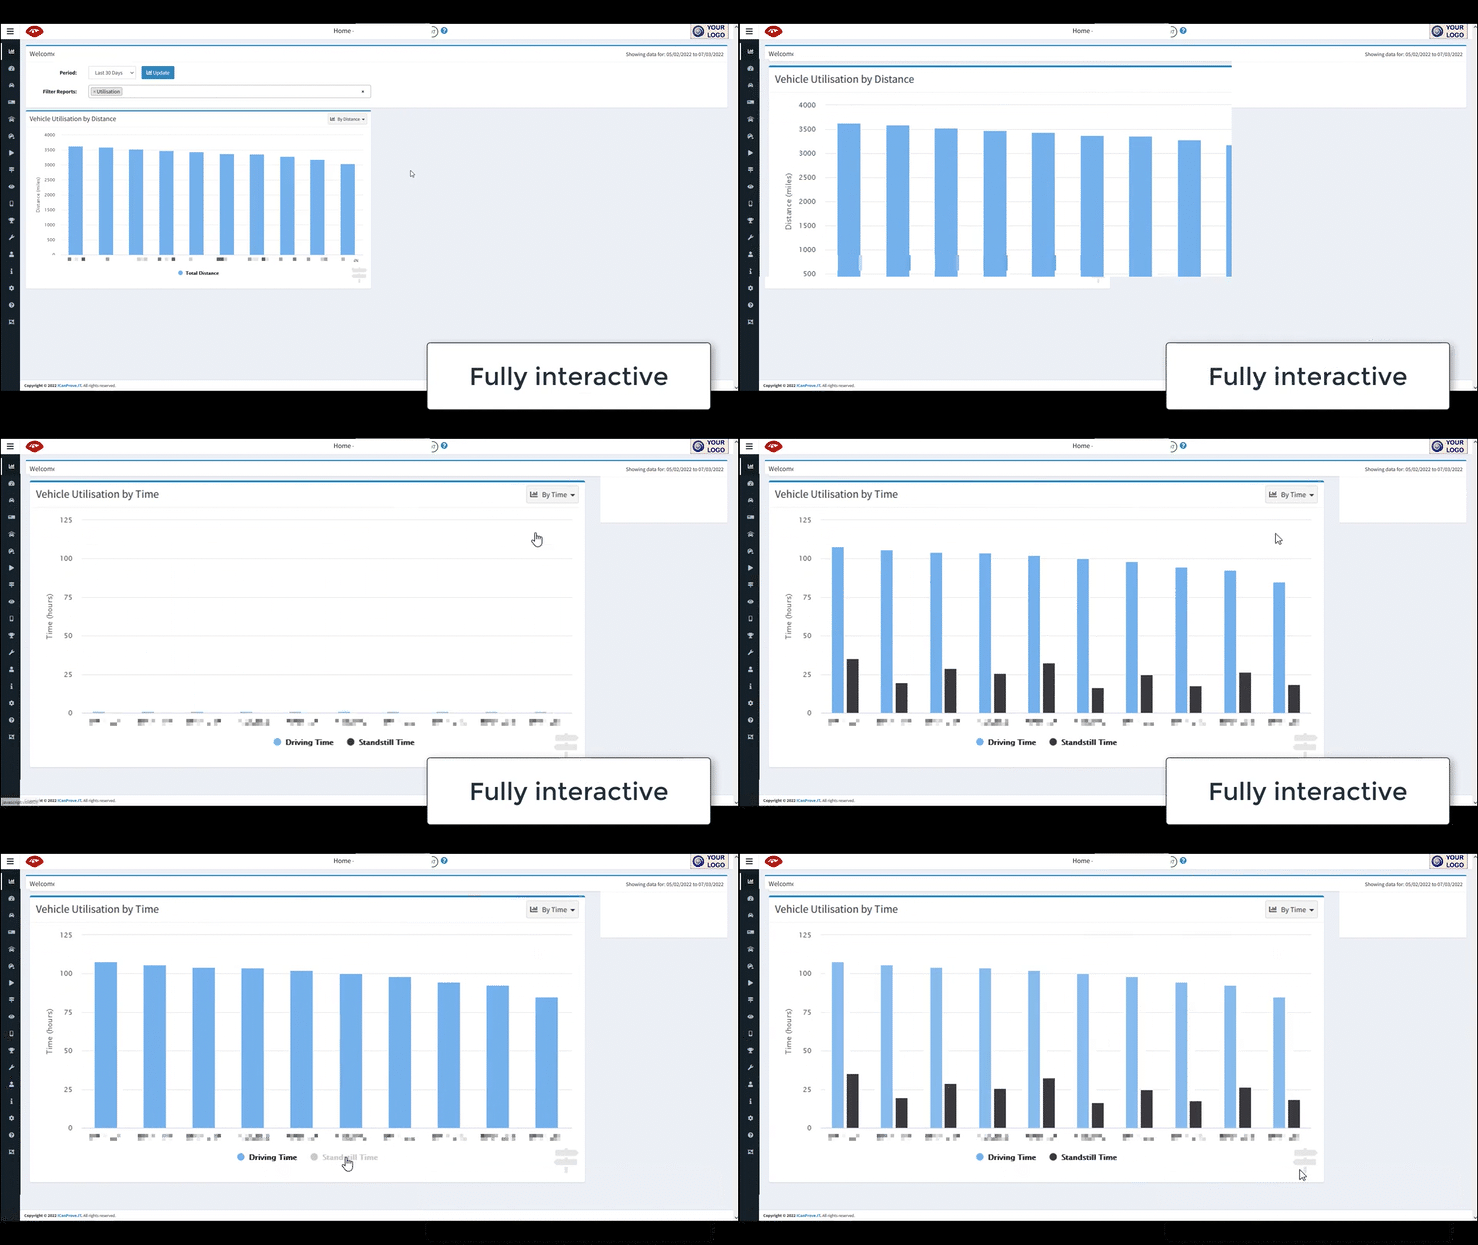
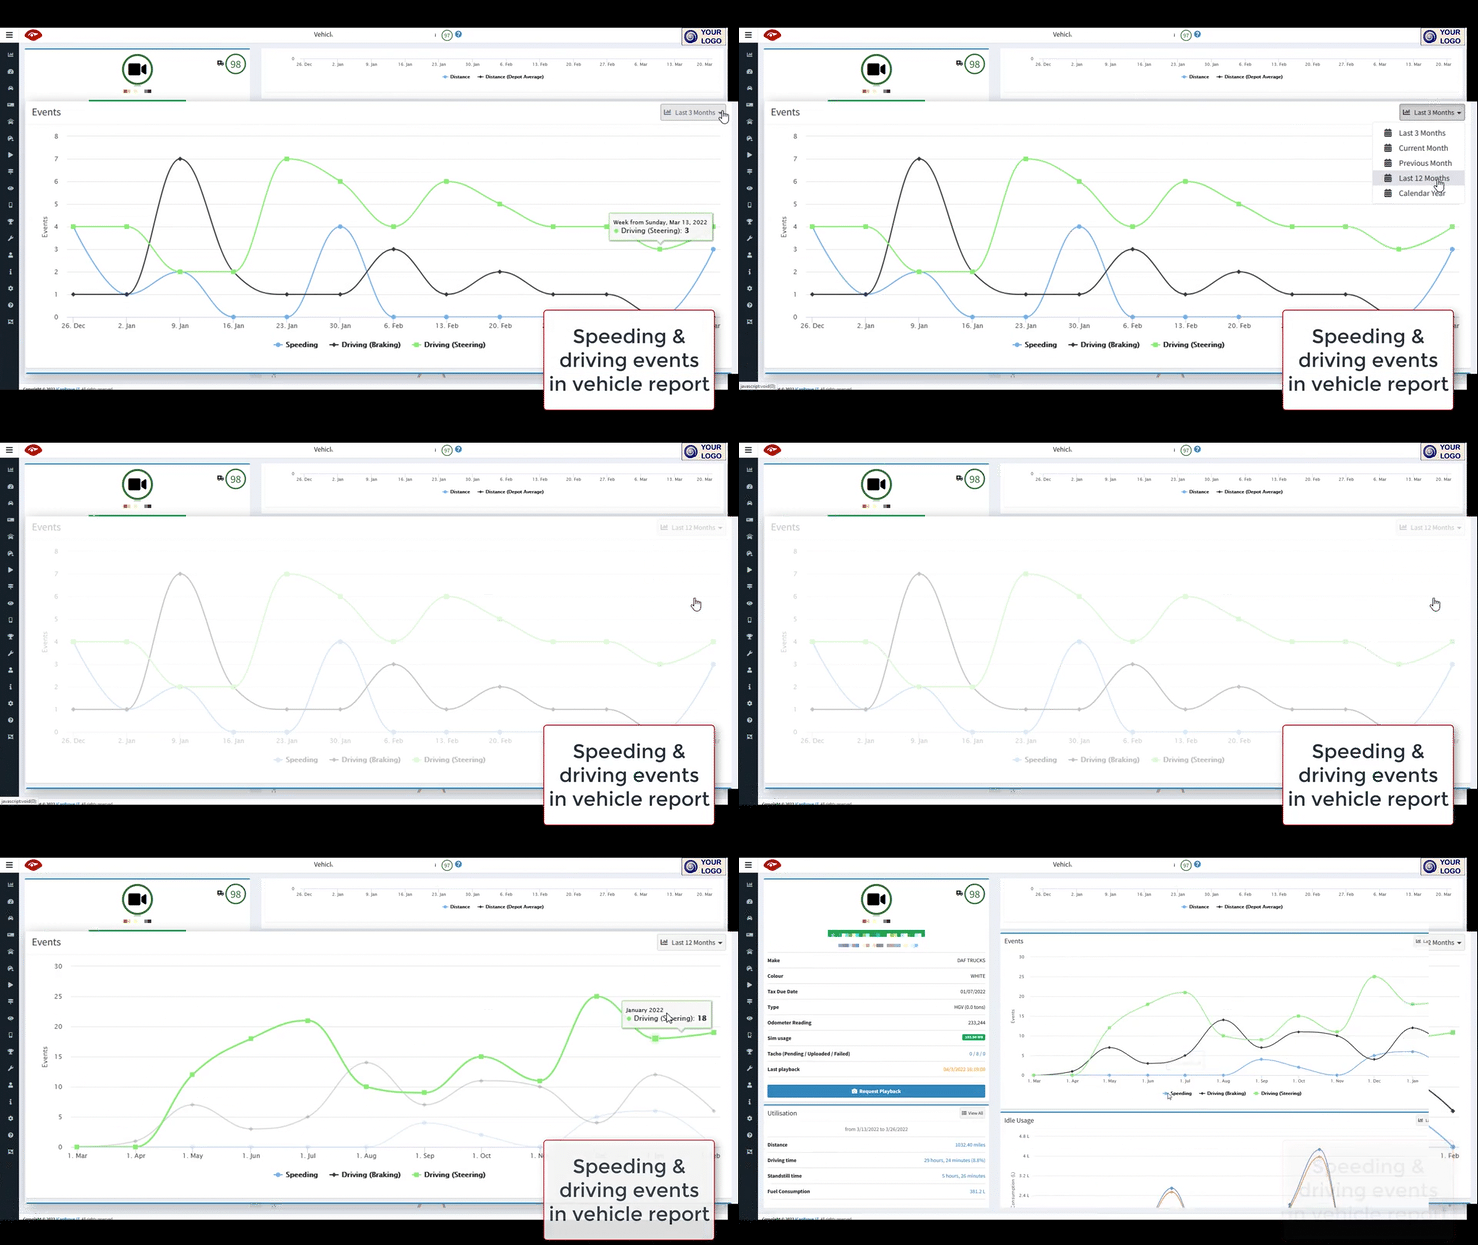
Starting with reports in your dashboard, there is a wealth of information about speeding, swerving, or harsh-braking. Spot trends in behaviour to improve safety across your fleet.
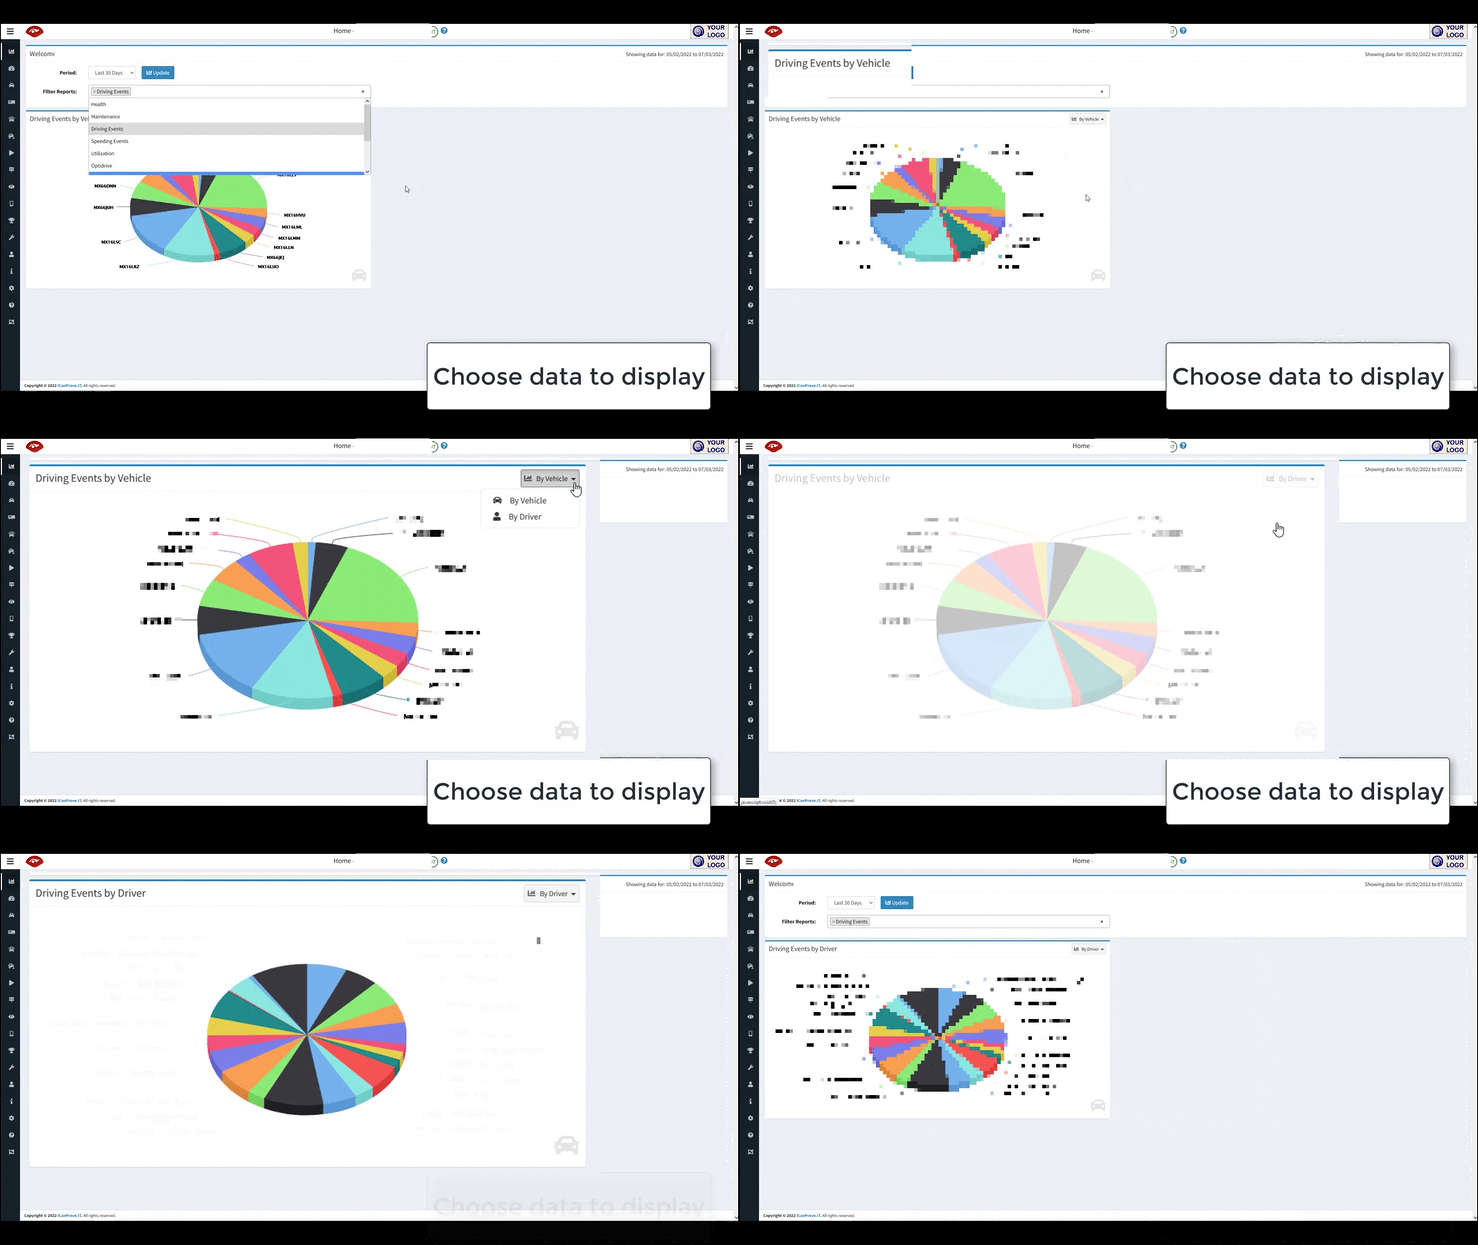
In the depot dashboard, there are two colourful pie charts to help you understand driving and speeding events for all fleet vehicles & drivers, over time or place.
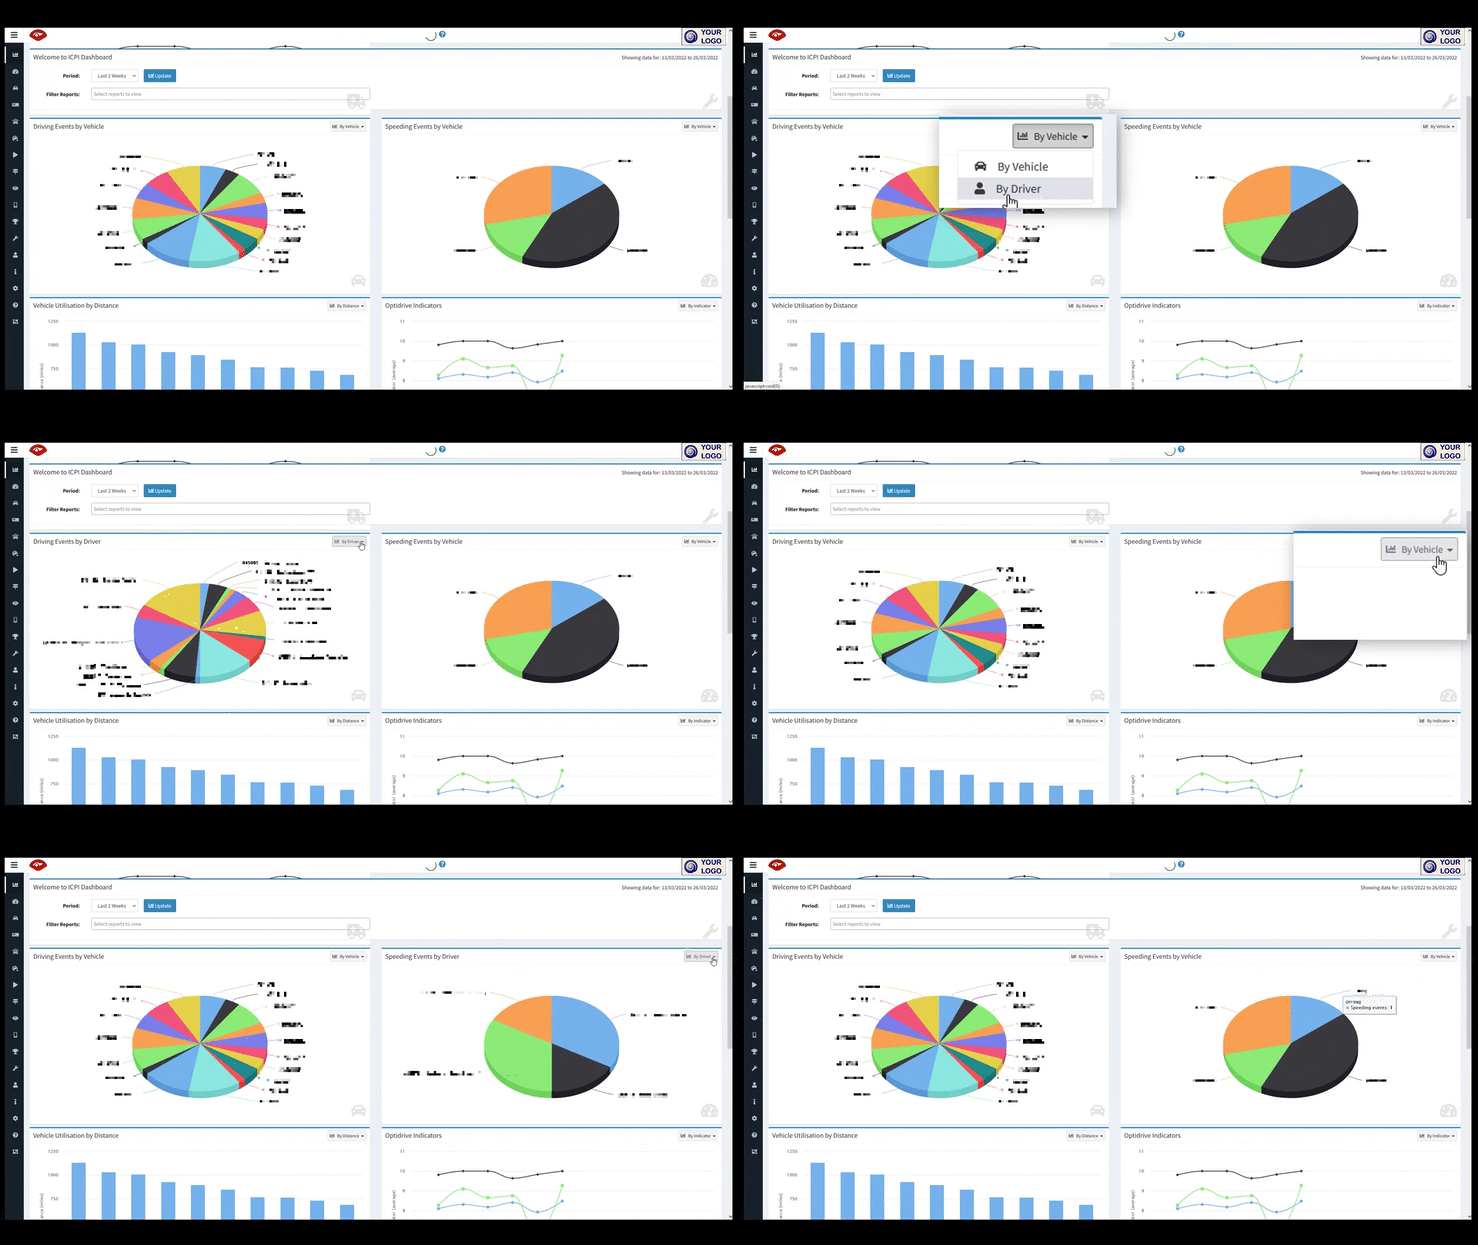
Change the time period to view the range of interest.

Speeding events have their own section in your menu.
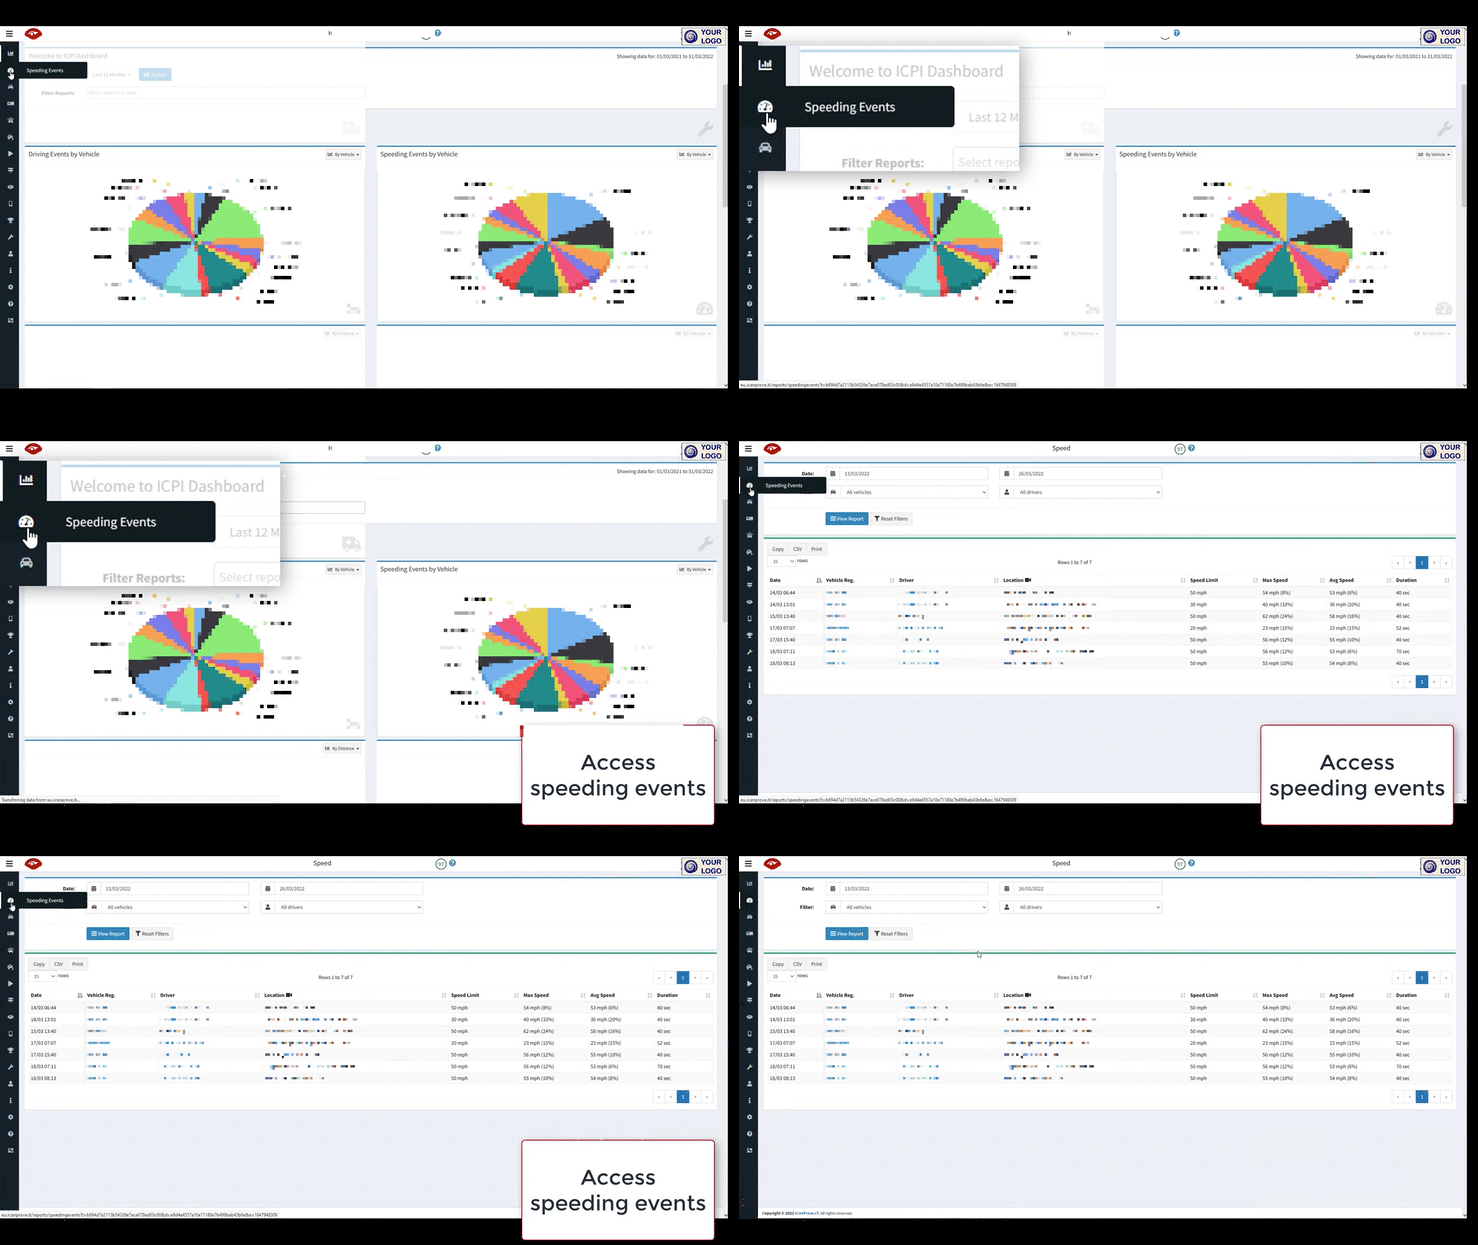
You will see:
Driving events also have their own section in your menu. They are defined as harsh braking or harsh steering.
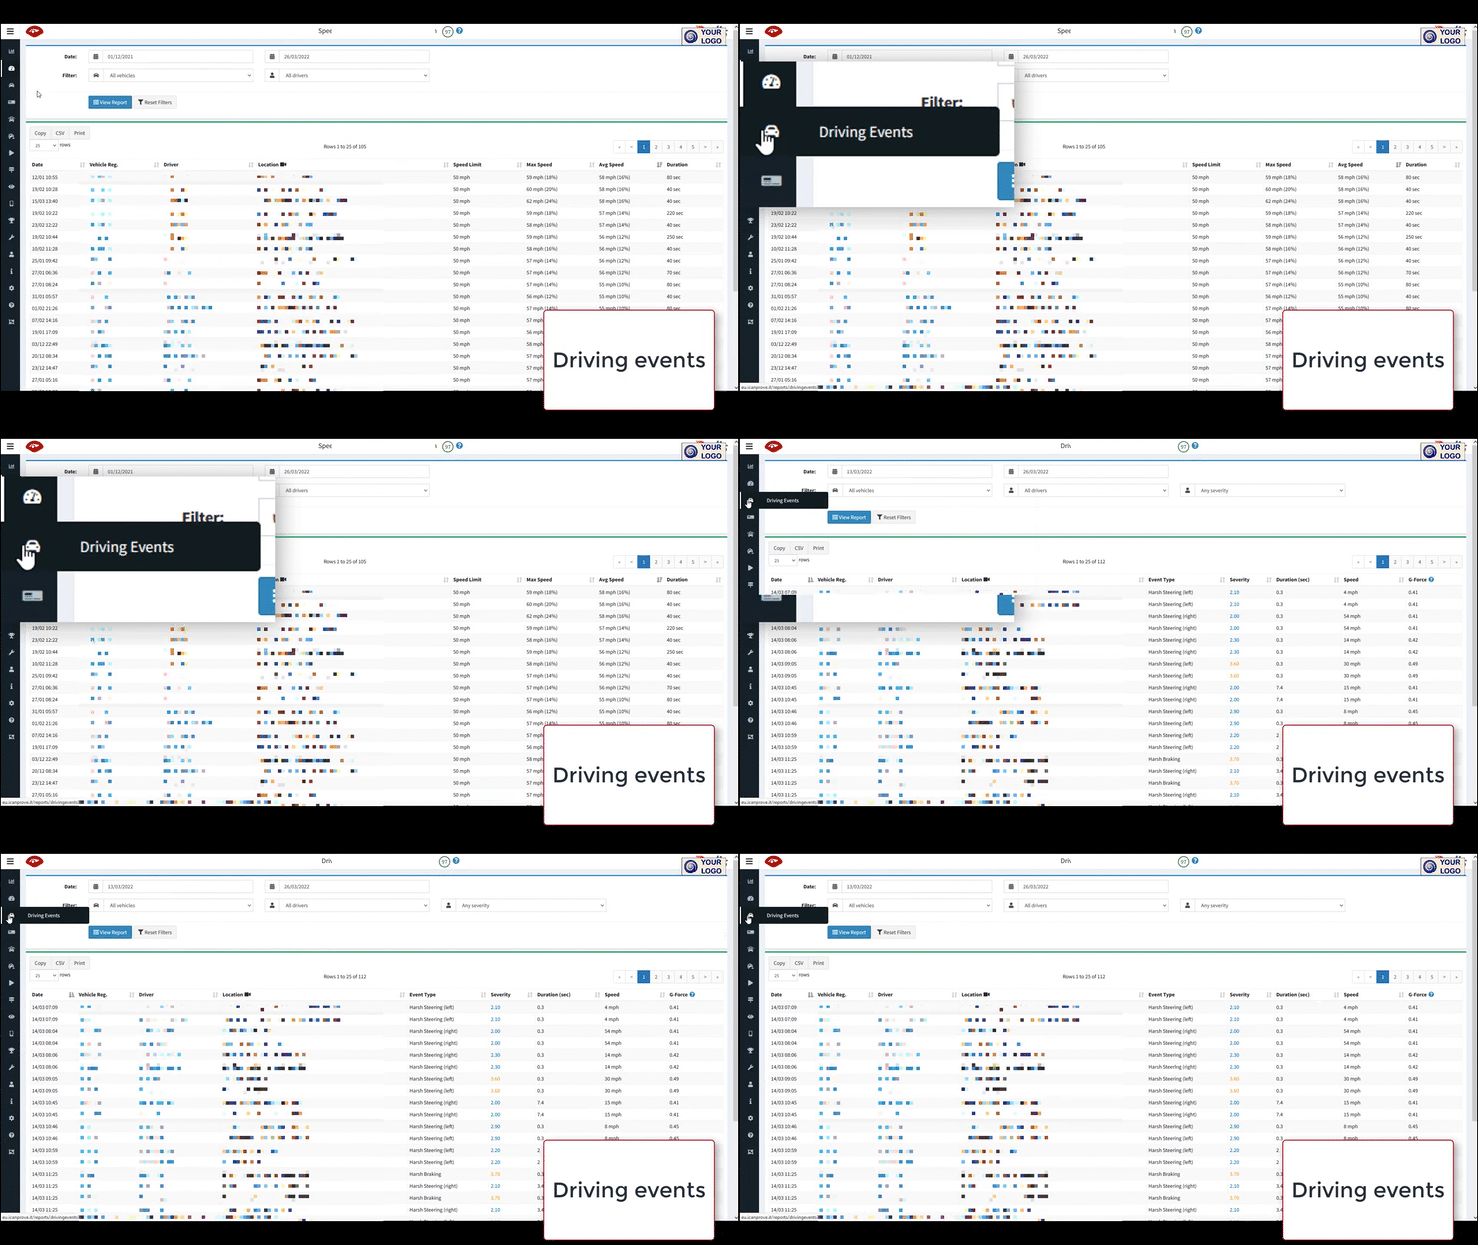
You will see:
With both speeding and driving event tables, you can change the date range for events to list, as required.
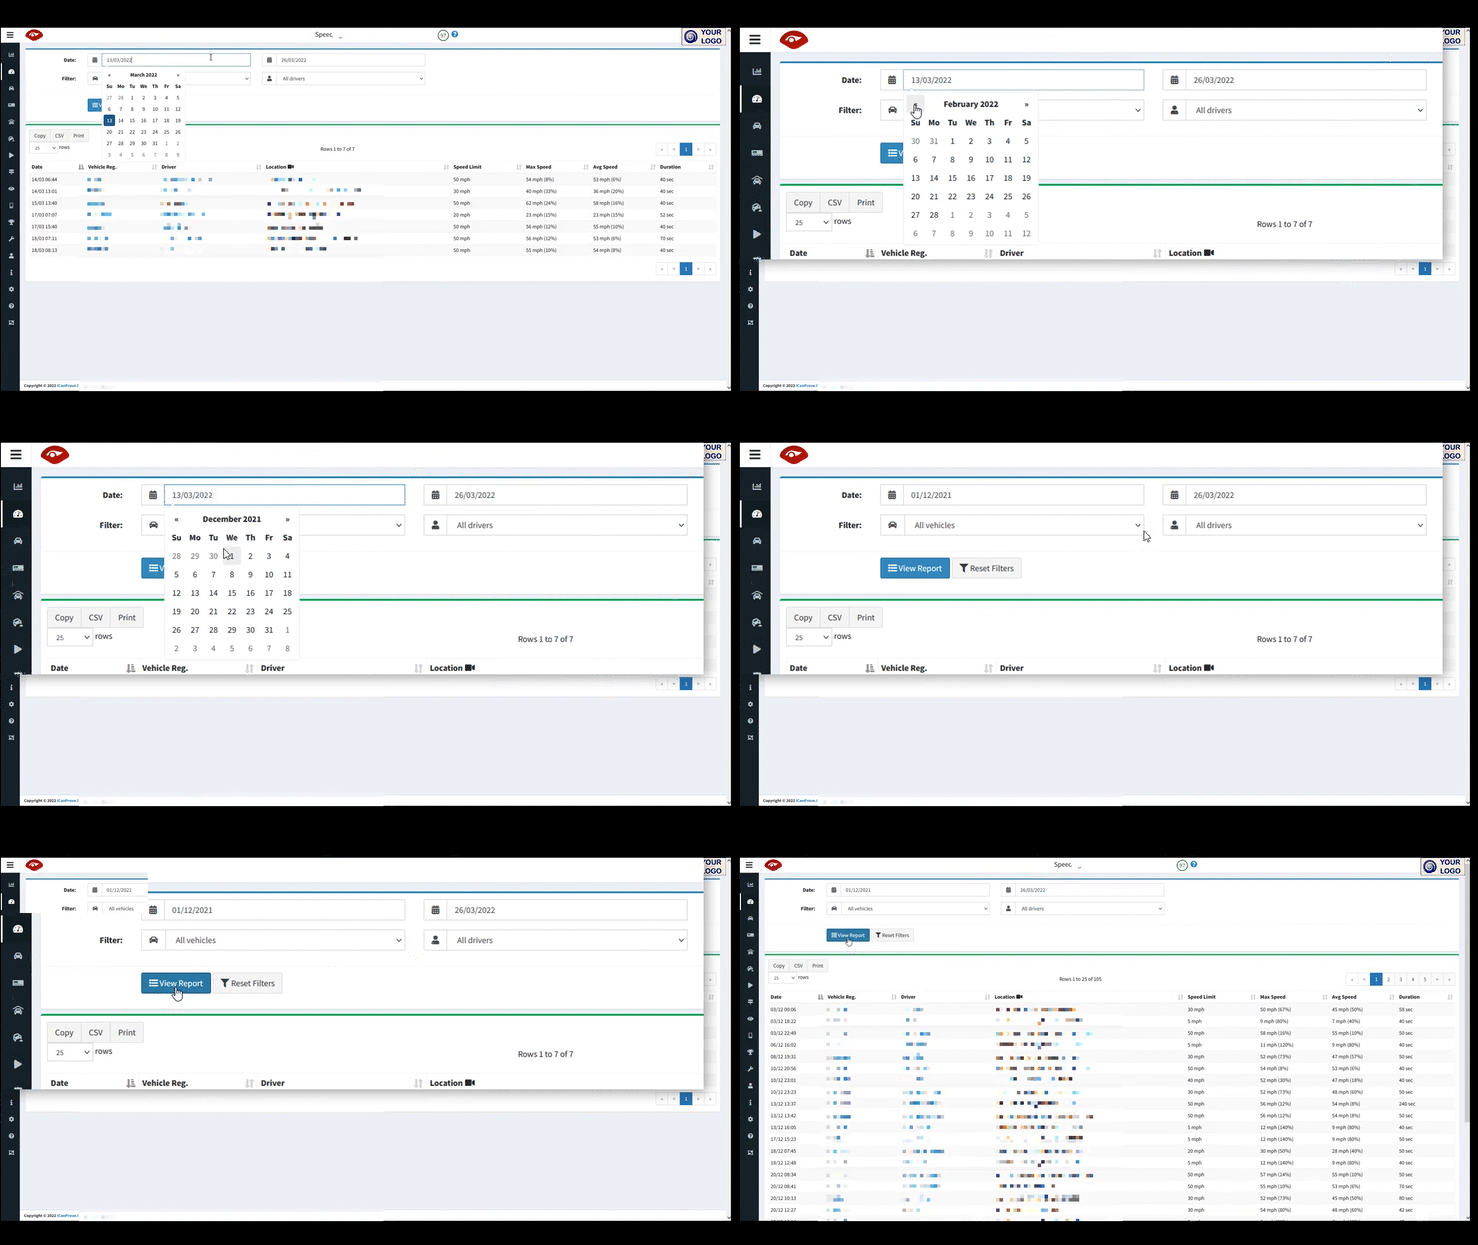
There are various filters available to find the correct events. Don’t forget to click ‘View Report’ to apply your selections, and ‘Reset Filters’ to revert to the standard view.
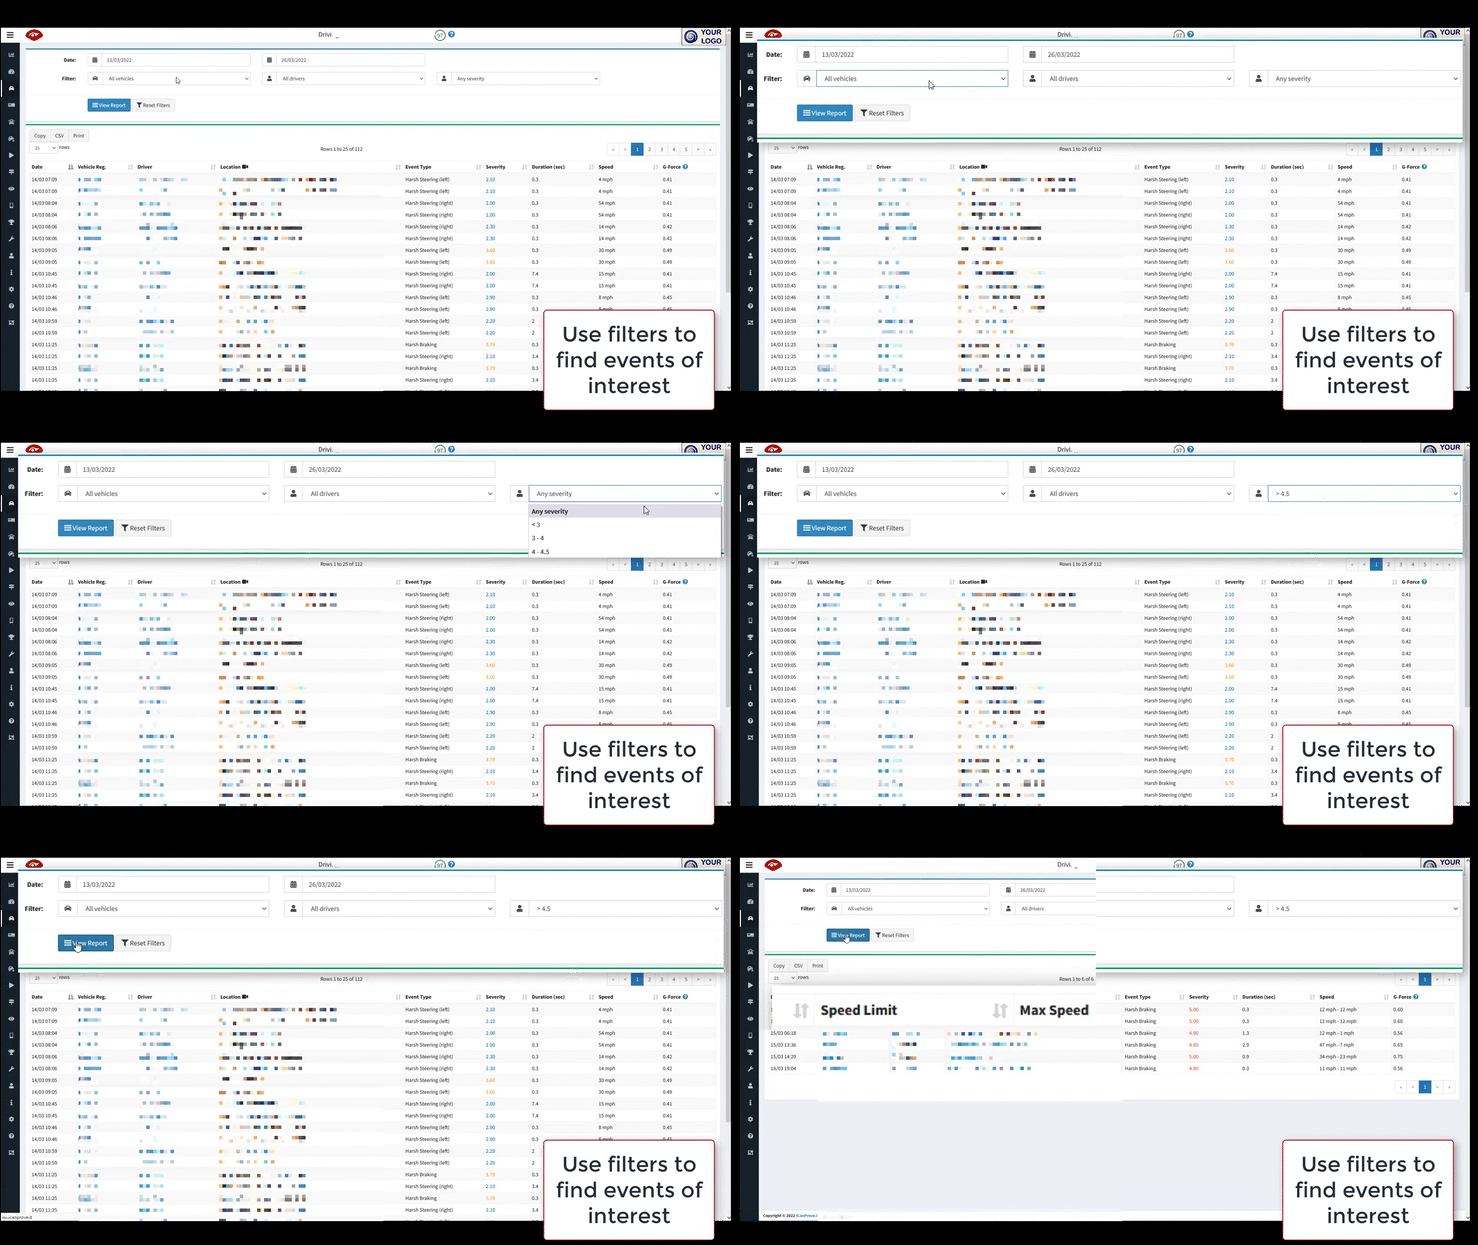
You can rearrange your view of the table by clicking on any column heading. Click once to sort low to high, and again to sort high to low.
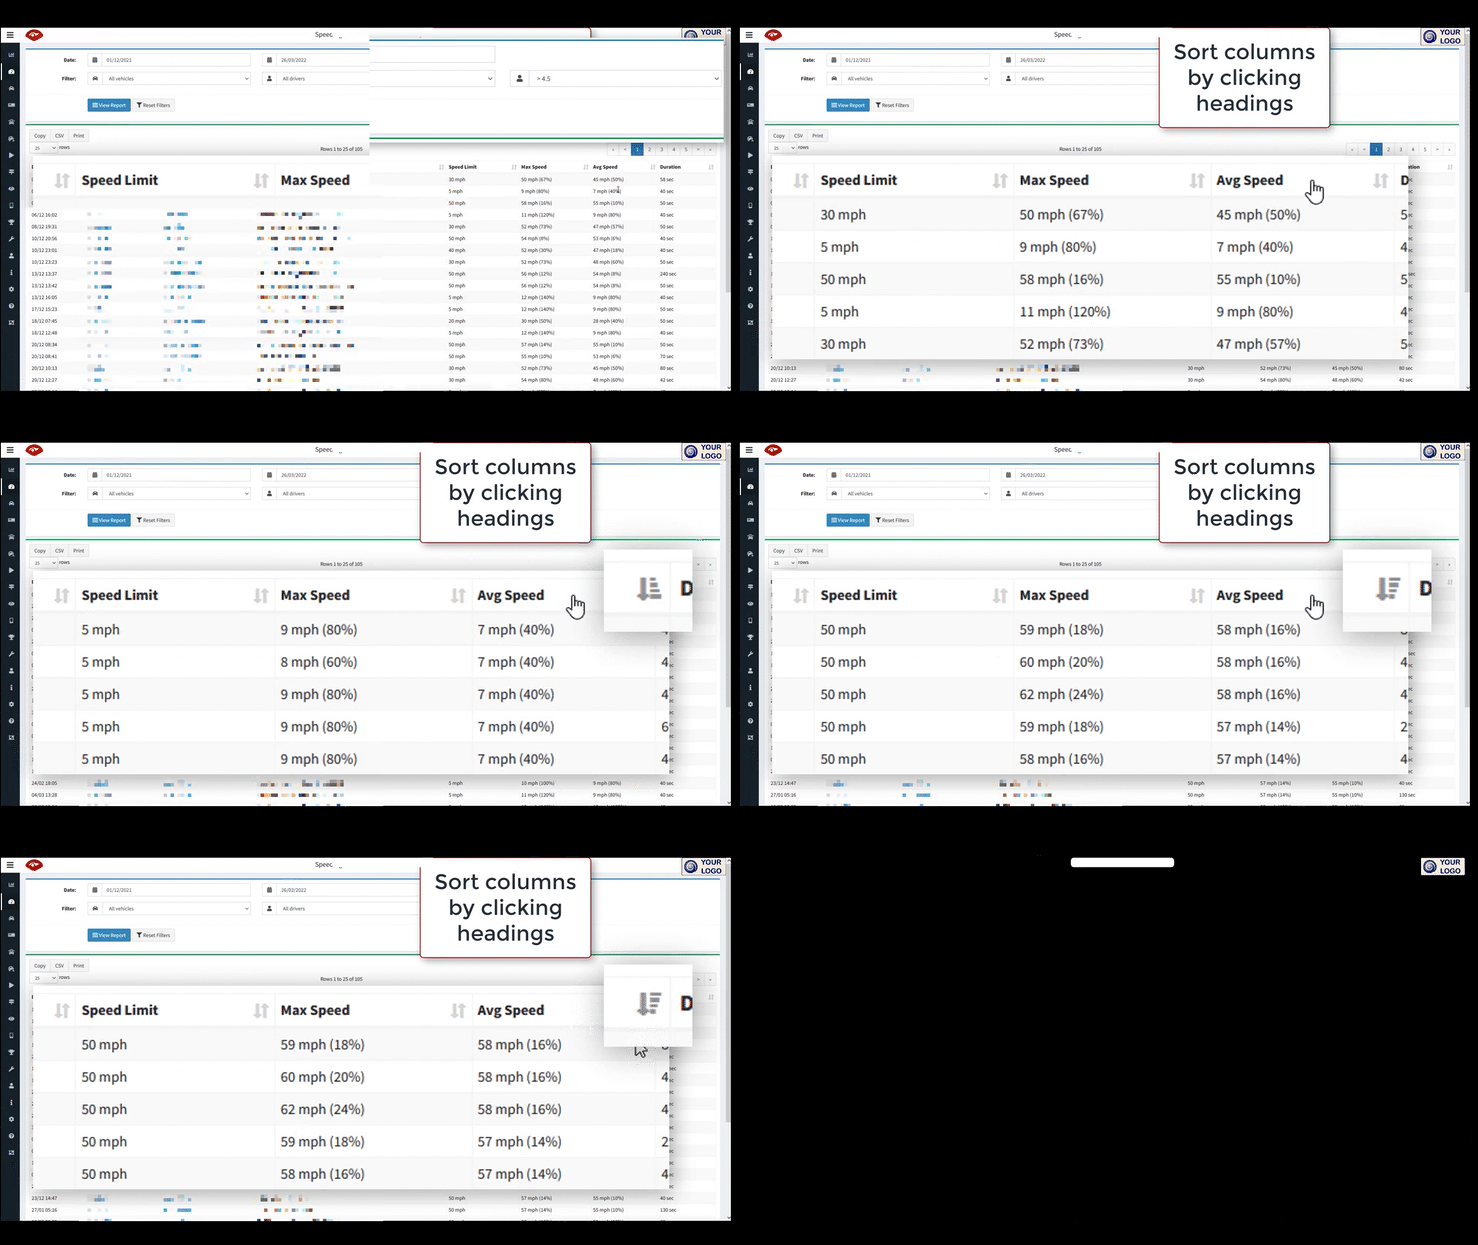
Click on the vehicle registration, or the driver name (if blue), to access a detailed report page. This report includes trends, as well as a comparison to depot averages.
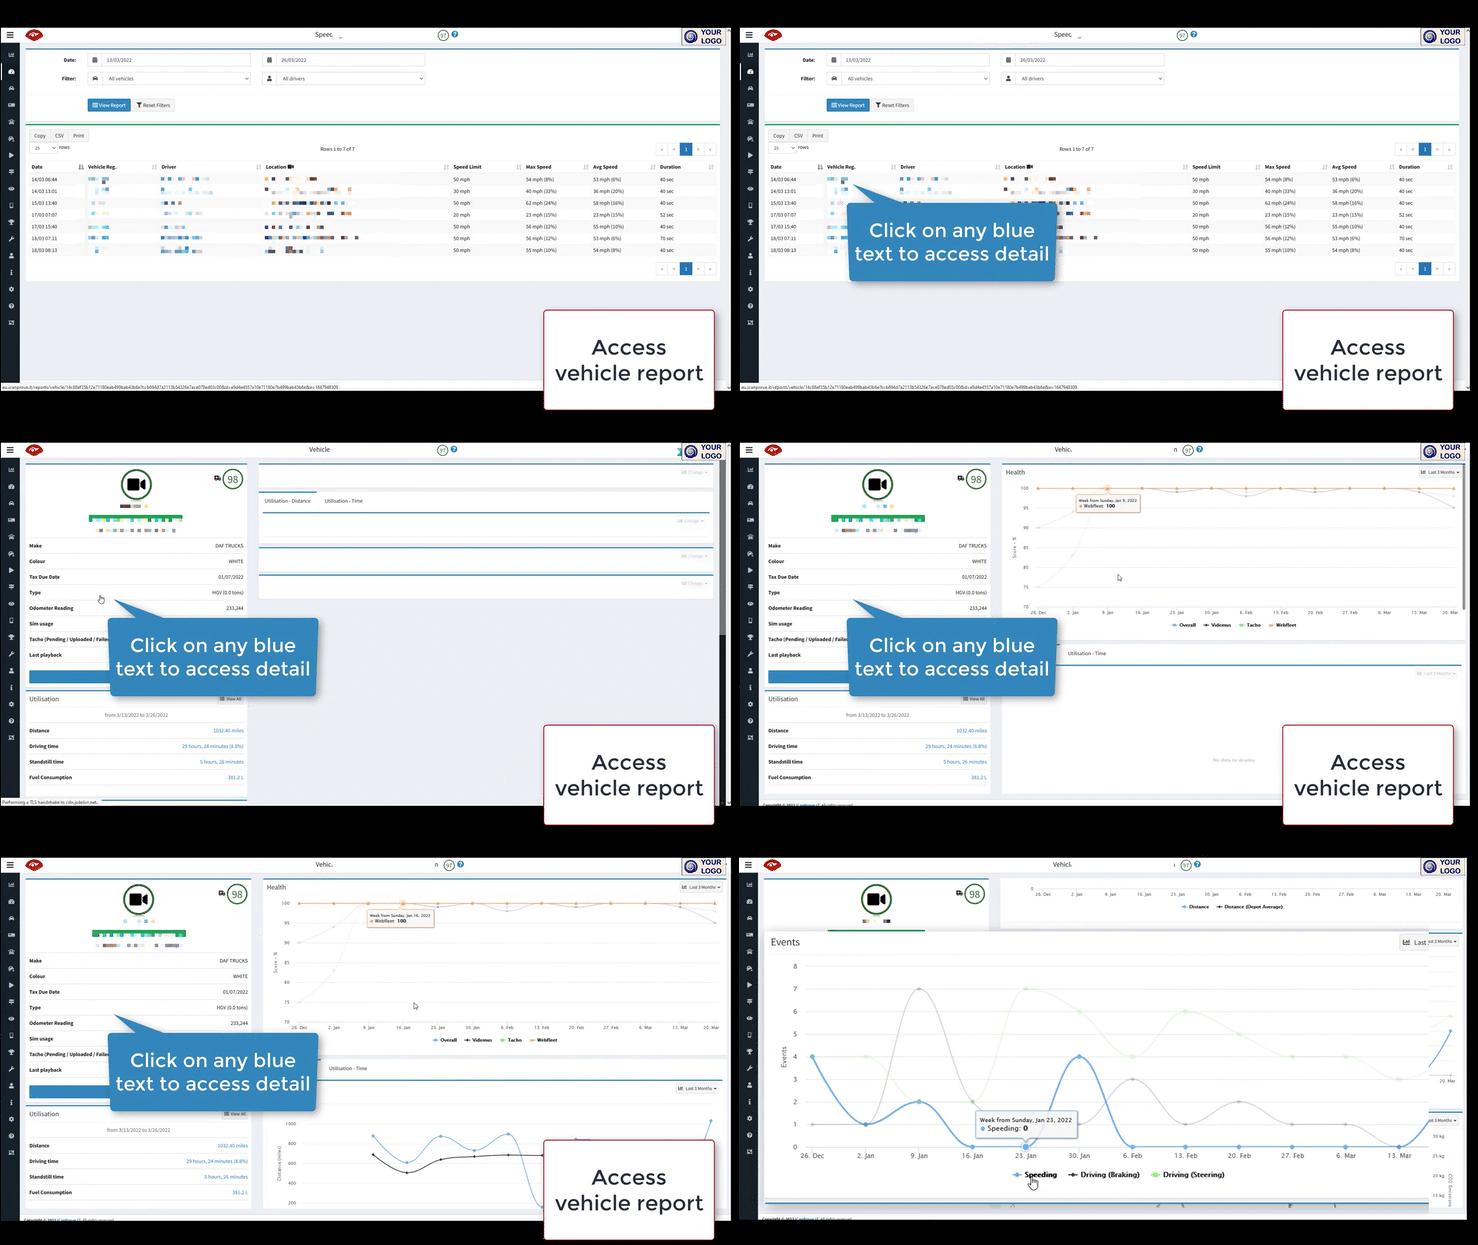
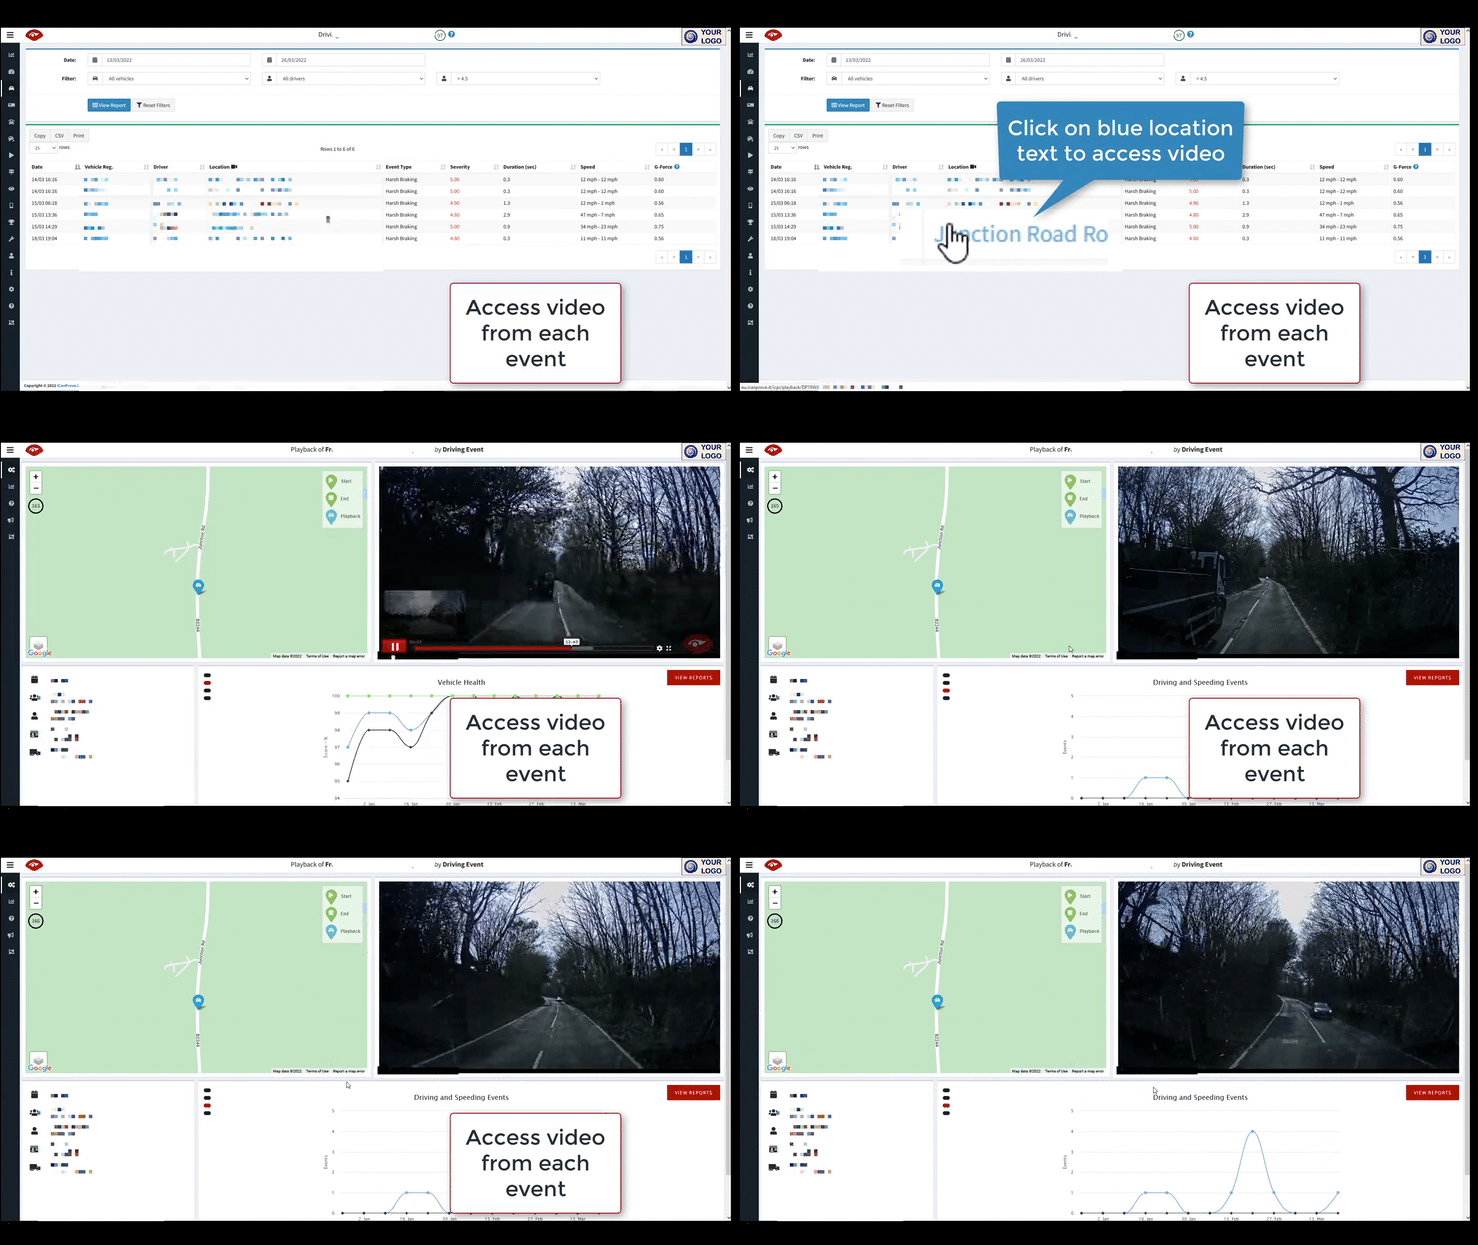
For any event that was severe enough to trigger automated video download, you can access the video file – set within our Videmus: connect page with full telematics and context. Just click on the location in the event table – where it is blue. (For more detail, on accessing or understanding video, please see Wiki page.)
Once you choose your depot of interest (or if you login as a depot manager), you will start at a depot info page, before being automatically forwarded to your dashboard.
The tacho pages have their own section here.
It is our mission to connect you with your teams on the road. See what is happening, even when you are not there to see for yourself; prove what happened in any incident; display data to make it easy to use; put video at the heart of your fleet planning and analysis; improve safety and efficiency.